AMD has published a new version of GPU PerfStudio. GPU PerfStudio is a profiler and debugger for OpenGL and Direct3D applications.
GPU PerfStudio 2.4 is a tool for software developers to use in debugging and performance tuning 3D graphics applications. It incorporates a Frame Debugger, Profiler, Shader Debugger and API Trace tool into a single unified IDE framework
Remark – DX9 developers: GPU PerfStudio 2.x does not support DirectX 9 applications.
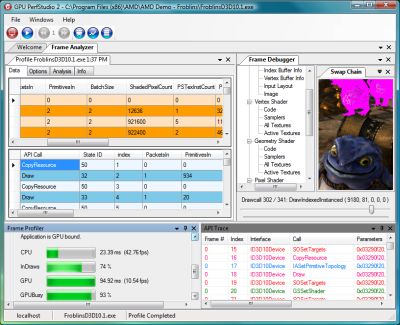
Big picture of GPU PerfStudio used to profile NV’s Alien vs Triangles demo:
GPU PerfStudio 2.4 – (1 picture total).
GPU PerfStudio 2.4 changelog:
- Improved connection process and UI.
- Improved interaction between API Trace and Frame Debugger.
- The shader code window now has line numbers.
- DX11 Better support for DrawIndexedInstancedIndirect, DrawInstancedIndirect, and DispatchIndirect.
- DX11 Improved support for multiple devices.
- DX11/DX10 – Frame Capture is now more stable.
- DX11 Improved support for multi-threaded applications.
- DX10 PerfMarkers are now supported in the API Trace and Profiler when Frame Capture is being used.
- OpenGL – Profiler now works on ATI Radeon HD 2400 series graphics cards.
- OpenGL – wglSwapLayerBuffers is now recognized as a frame boundary.
- Profiler column headers now indicate units, percentages (%), milliseconds (ms), bytes (b), and kilobytes (kb).
- Profiler now supports ATI Radeon HD 6000 series graphics cards.
- Improved ordering of the profiler counters . Improved depth and stencil profiler counters.
Works fine with Cedar 😀
http://img2.imagebanana.com/img/5i1b2mur/stefan.gpuperfstudio.tessman.png
@Stefan: added in the Big Pictures section!
And still no solution for bug with new Catalyst drivers with OpenGL 4 support (PerfStudio takes forever to connect with application and enable frame debugger). Details at http://forums.amd.com/devforum/messageview.cfm?catid=347&threadid=142797&enterthread=y
AMD has opengl issues?
no way, you don’t say.