Intel has released a new revamped version of its tool PresentMon. Since it’s a new version, the versioning starts at 0.5 (all legacy PresentMon libraries and tools are available here).
This new version of PresentMon works with all GPUs (Intel, NVIDIA and AMD) and has a graphical user interface and a nice overlay to display GPU and CPU data. PresentMon supports all 3D APIs: OpenGL, Direct3D 9/(10?)/11/12 and Vulkan on Windows 10/11. Beside the new GUI and monitoring overlay, PresentMon can also run via command line.
A new gaming performance overlay and telemetry application to monitor and measure your gaming experience.
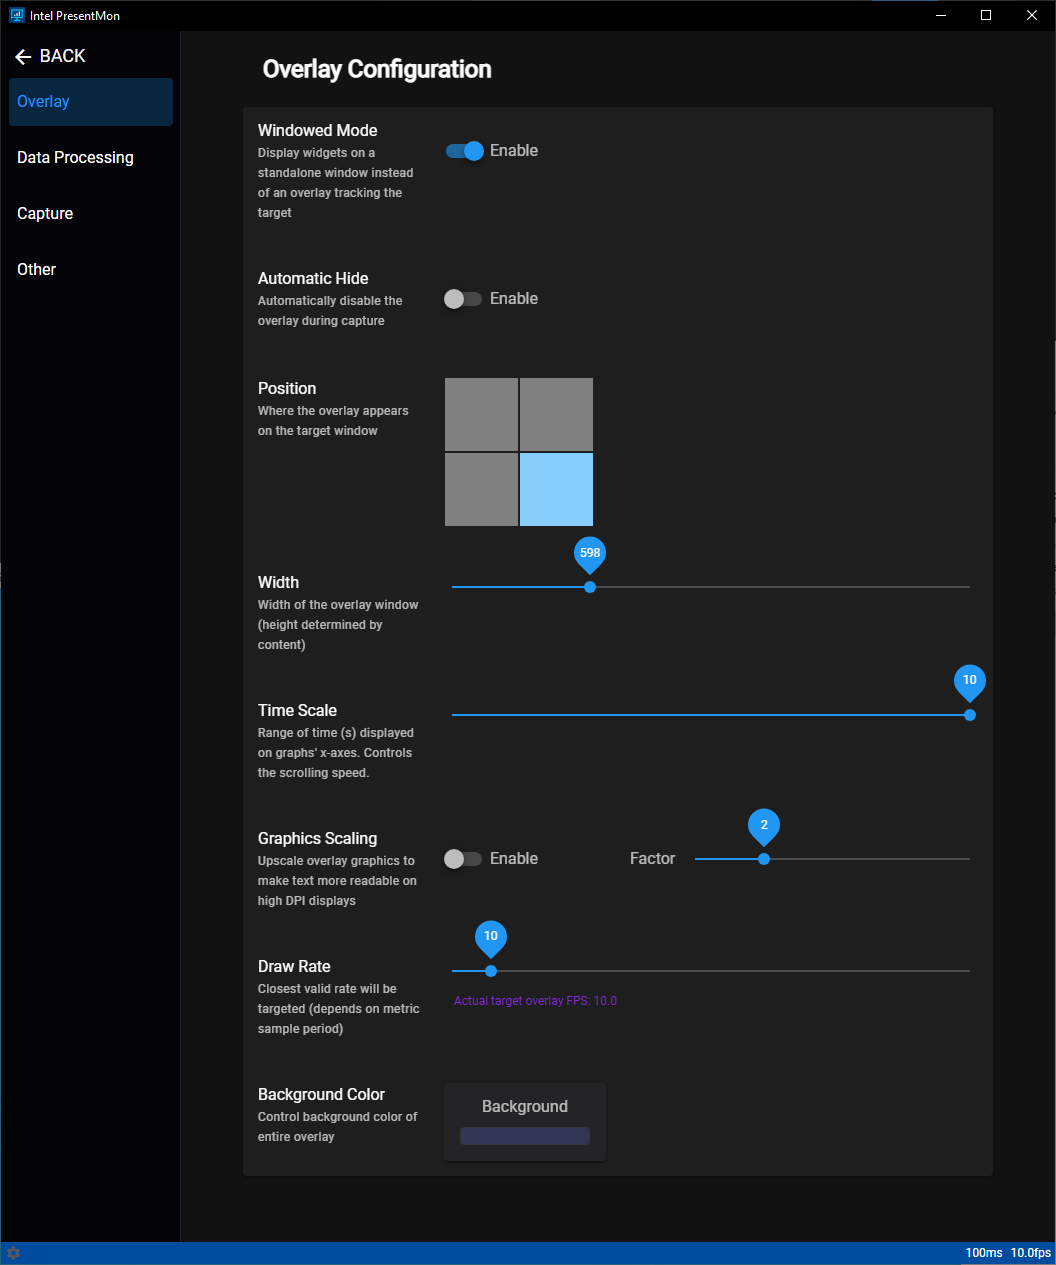
Configurable Overlay with Real-time Graphing
Bring your game performance to life through a fully customizable overlay with real-time performance charting that supports multi-line graphs and histograms. Now you can see real-time raw numbers, percentiles, rolling-window averages, and more to understand your gaming experience.
Combined GPU Telemetry and Performance Capture
Intel PresentMon combines performance and GPU telemetry data into a single overlay and capture utility, allowing you to better evaluate your system during, or after, your gaming session.
Discover Performance Bottlenecks
Innovative new GPU Busy metric shows real time CPU + GPU balance and how the resources in your machine are being utilized, allowing you to better evaluate computing bottlenecks in your games.
More information is available on the homepage and in the announcement article.
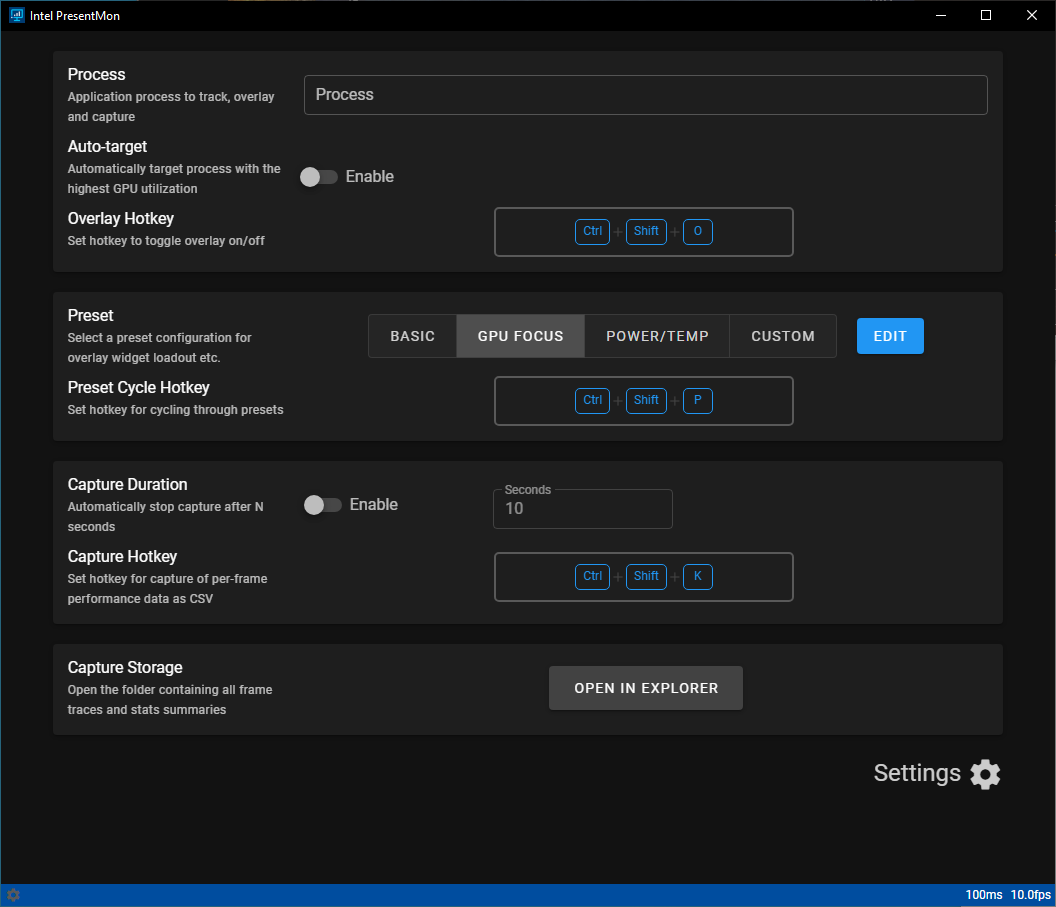
The user interface for settings:
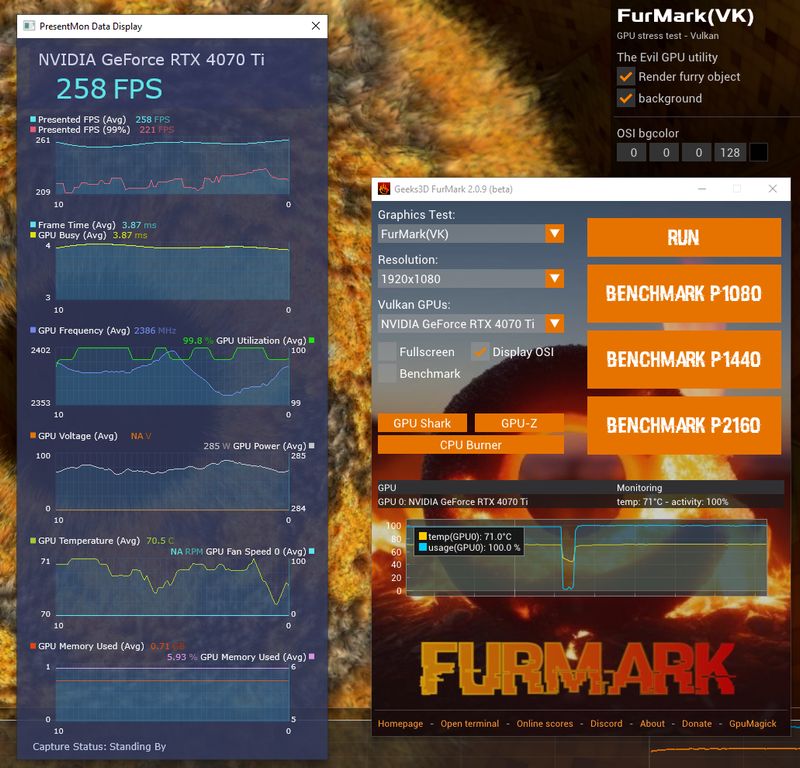
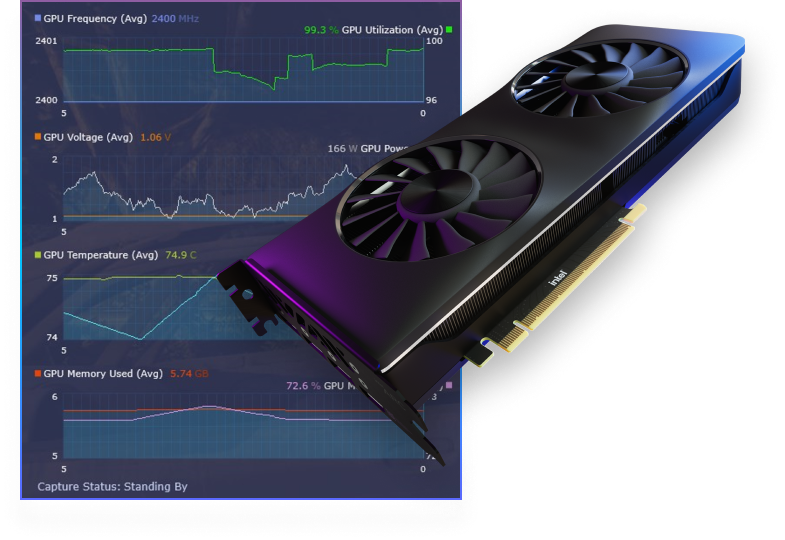
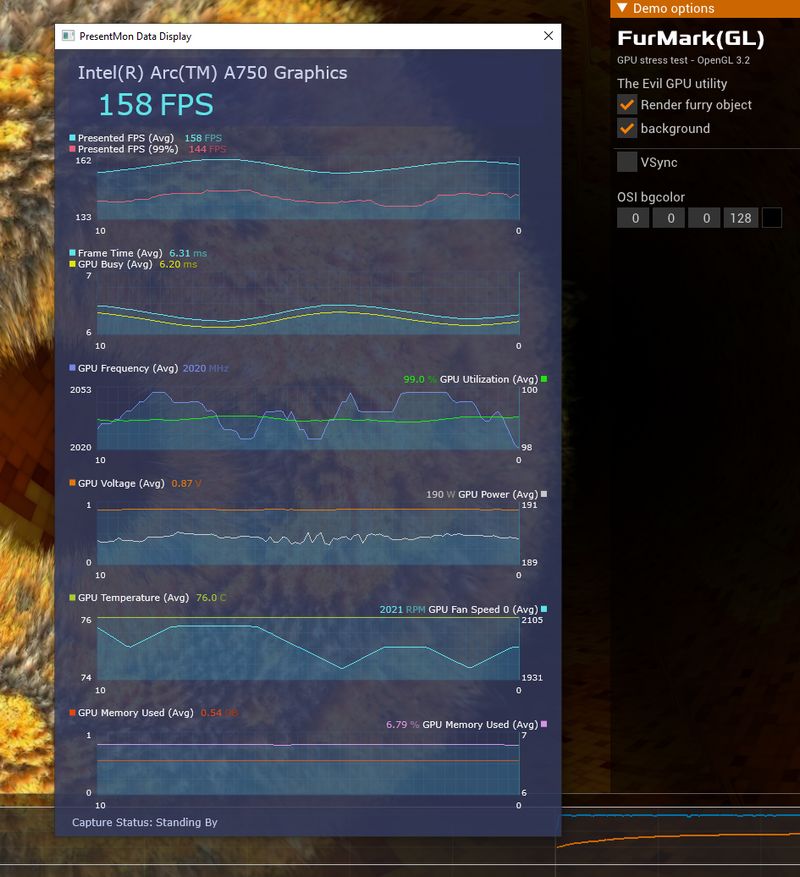
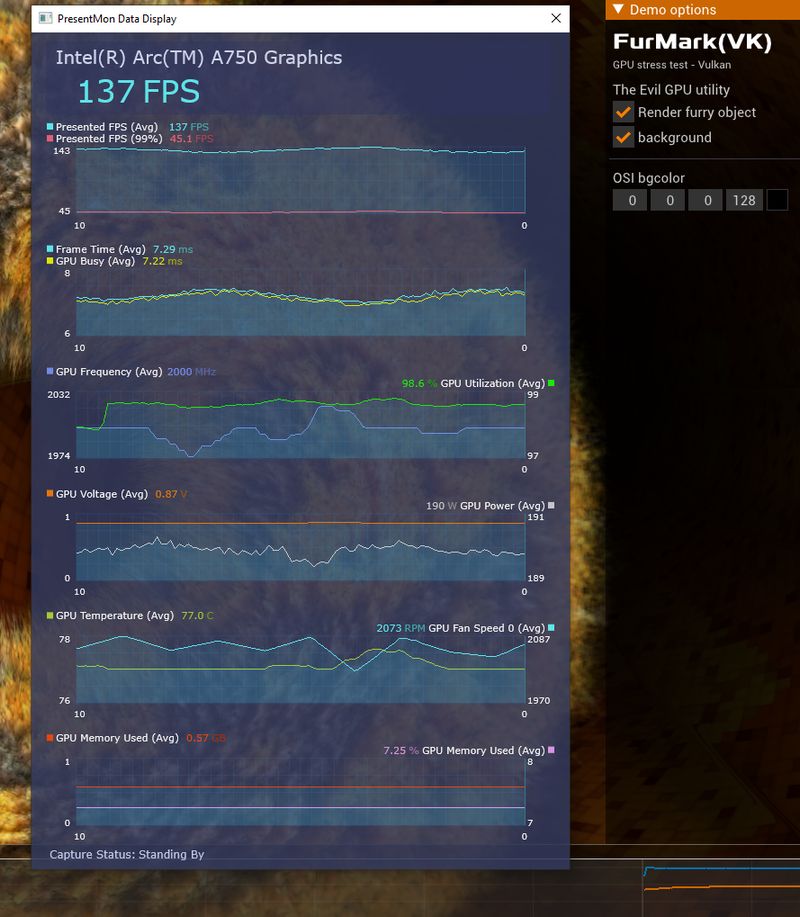
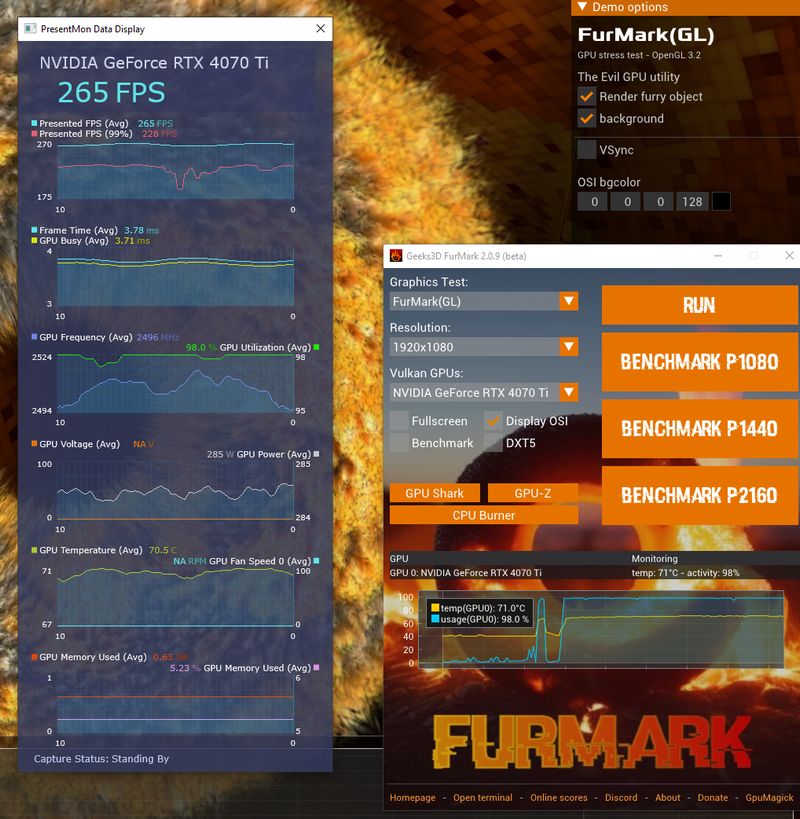
I tested PresentMon with FurMark 2 on an Intel Arc A750 and on an NVIDIA GeForce RTX 4070 Ti.
Intel Arc A750 – OpenGL
Intel Arc A750 – Vulkan
NVIDIA GeForce RTX 4070 Ti – OpenGL
NVIDIA GeForce RTX 4070 Ti – Vulkan