Some readers asked me how much better is the GeForce GTX 680 in PhysX compared to previous GTX 580 and GTX 480. To bring an element of answer, I quickly tested the GTX 480, GTX 580 and GTX 680 with FluidMark 1.5.0 with different settings (on H67 testbed). Graphics drivers: R301.24.
The GeForce GTX 480 is the reference card (score is 100%).
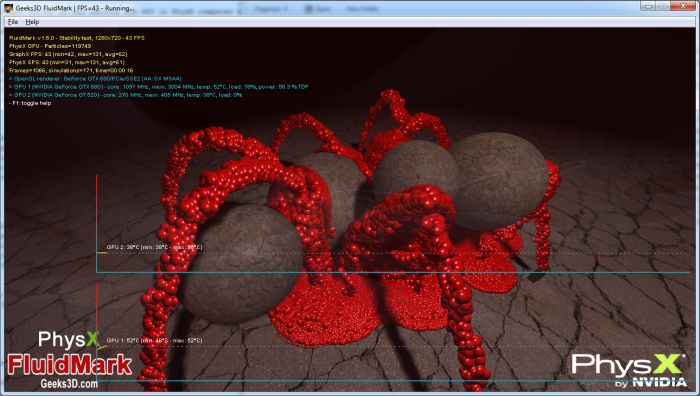
Test 1 – Preset:720 (30000 SPH particles, 1280×720 fullscreen)
| EVGA GeForce GTX 480 (GPU@700MHz, mem@1848MHz) – 4699 points, 77 FPS (100%) |
| EVGA GeForce GTX 580 (GPU@797MHz, mem@2025MHz) – 5590 points, 92 FPS (118%) |
| EVGA GeForce GTX 680 (GPU@1097MHz, mem@3004MHz) – 8395 points, 137 FPS (178%) |
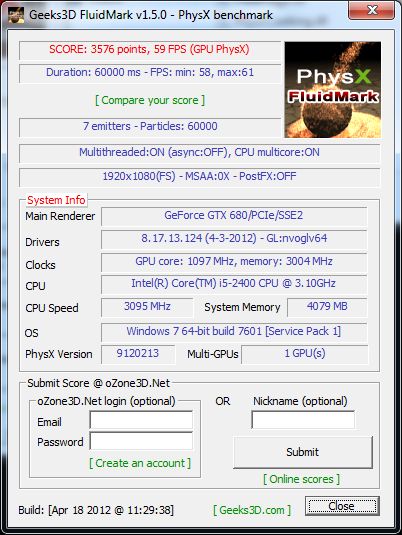
Test 2 – Preset:1080 (60000 SPH particles, 1920×1080 fullscreen)
| EVGA GeForce GTX 480 (GPU@700MHz, mem@1848MHz) – 1509 points, 25 FPS (100%) |
| EVGA GeForce GTX 580 (GPU@797MHz, mem@2025MHz) – 1807 points, 30 FPS (119%) |
| EVGA GeForce GTX 680 (GPU@1097MHz, mem@3004MHz) – 3576 points, 59 FPS (236%) |
Test 3 – Custom settings: 120000 SPH particles, 1920×1080 fullscreen
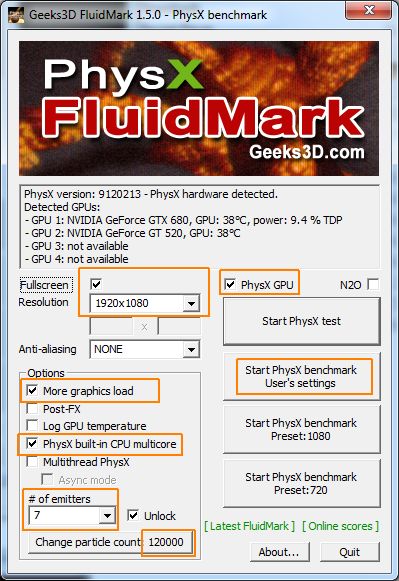
| EVGA GeForce GTX 480 (GPU@700MHz, mem@1848MHz) – 253 points, 21 FPS (100%) |
| EVGA GeForce GTX 580 (GPU@797MHz, mem@2025MHz) – 300 points, 25 FPS (118%) |
| EVGA GeForce GTX 680 (GPU@1097MHz, mem@3004MHz) – 530 points, 44 FPS (209%) |
If we took the GTX 480 as the reference card (100%), the GTX 580 is around 19% faster while the GTX 680 is 78% up to 136% faster in these PhysX fluids tests. The performance boost of the GTX 680 scores is rather impressive…
So… looks like PhysX is rather ALU limited, and the SW scheduling in Kepler doesn’t affect the performance. Good to know. 😉
the more parallel works, the wider difference between GF1X0 and GK104.. it needs crap load of threads to justify it’s raw ALU performance
GK104 in fact has a smaller pool of threads to pick from — 16K, versus 24K for GF100/110. That makes Kepler more sensitive to data locality issues for the global memory access, on top of the SW scheduling. Apparently, this is not the case in this particular compute-intensive workload.
I just got 9828 with my GTX 670 on 720p mode, 3720 on 1080p
I have the GTX 480 and my scores were quite a bit higher, apart from the custom 120,000 SPH test where I got 24 FPS and 270 points.
Here’s my score for Test 2 – Preset:1080 (60000 SPH particles, 1920×1080 fullscreen)
SCORE: 2547 points, 42 FPS (GPU PhysX)7 emitters – Particles: 60000.
I also scored about 500 points more in Test 1 than your GTX 480.
Why would this be?