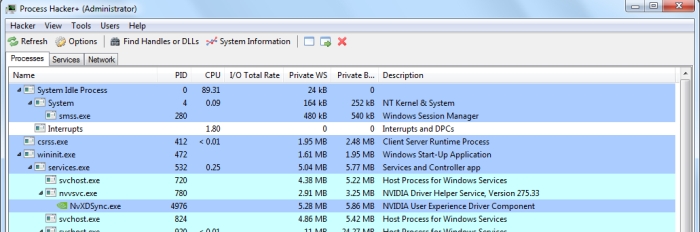
Process Hacker can be seen as the open-source clone of Process Explorer. Process Hacker is a Windows utility for manipulating processes, threads and services. It can replace Windows task manager. Here are the key features:
- A simple, customizable tree view with highlighting showing you the processes running on your computer.
- Detailed system statistics with graphs.
- Advanced features not found in other programs, such as detaching from debuggers, viewing GDI handles, viewing heaps, injecting and unloading DLLs, and more.
- Powerful process termination that bypasses security software and rootkits.
- View, edit and control services, including those not shown by the Services console.
- View and close network connections.
- Starts up almost instantly, unlike other programs.
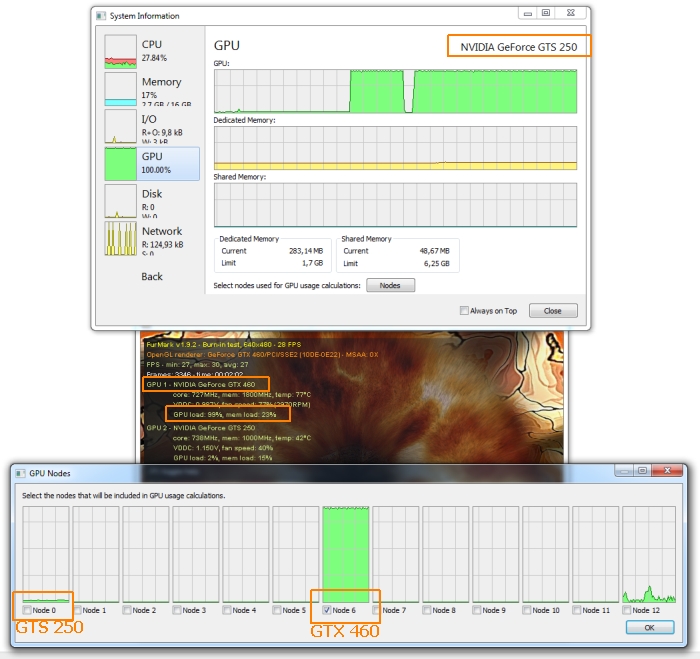
In a recent version of Process Hacker (the version 2.23 to be accurate), the support of GPU monitoring has been added. Then I quickly tested the monitoring of GPU usage (or load) with FurMark. On my system, I have a GTX 460 (primary renderer) and a GTS 250 as a secondary card. Like Process Explorer, there are nodes (engines in Process explorer) that should represent GPU units or something like that. By default, the node 0 is selected, which corresponds to the GTS 250, the secondary card in my PC. To monitoring the GTX 460, I had to check the node 6. The indication GeForce GTS 250 is wrong, should be GeForce GTX 460.
I think I’ll keep using EVGA Precision / MSI Afterburner / GPU Shark to monitoring my GPUs. But for playing with system threads and processes, Process Hacker is a nice tool. What’s more, the availability of the source code makes it a great way to dive into Windows’s internals.
More information about Process Hacker can be found HERE. Process Hacker 2.25 binaries as well as the source code can be downloaded HERE.
this is a nice replacement for task manager..
GPU area needs some tweaking imo..
with 2 cards in my system its showing the 2nd card first..primary card starts at node 6..
im noticing the nodes are for different things..eg..if i run fluidmark, i see usage on nodes 6 and 7..if i run the OpenGL demos i only see usage on node 6, but if i run the OpenCL demos i see slight usage on node 6, and heavy usage on node 7 and 12!..looks like nodes 7 and 12 are cuda maybe? while node 6 is pure graphics?
and if you select more than one node, the main graph doubles (dunno if thats the right way to explain it!)..eg..if you select node 6 and node 7, and have 100% useage on node 6, then the main graph will show 50% usage
GPU monitoring relies on D3DKMT functions (kernel mode) like D3DKMTQueryStatistics(). D3DKMT functions descriptions can be found here. D3DKMTQueryStatistics is not documented…