ASUS ENGTX 560 Ti DirectCU II TOP Review Index
- 1 – ASUS GTX 560 Ti DirectCU II TOP: Presentation
- 2 – ASUS GTX 560 Ti DirectCU II TOP Features
- 3 – ASUS GTX 560 Ti DirectCU II TOP OpenGL performances
- 4 – ASUS GTX 560 Ti DirectCU II TOP Direct3D performances
- 5 – ASUS GTX 560 Ti DirectCU II TOP Gaming performances
- 6 – ASUS GTX 560 Ti DirectCU II TOP DirectCompute performances
- 7 – ASUS GTX 560 Ti DirectCU II TOP Power consumption and overclocking
- 8 – ASUS GTX 560 Ti DirectCU II TOP Conclusion
3 – ASUS GeForce GTX 560 Ti DirectCU II TOP OpenGL performances
Testbed:
– CPU: Core i7 960 @ 3.2GHz
– RAM: 4GB DDR3 Corsair Dominator
– Motherboard: GIGABYTE X58-A UD5
– Windows 7 64-bit
– Graphics drivers: R266.44
– PSU: Corsair AX1200
3.1 FurMark (OpenGL 2)
FurMark 1.8.2 has been used for the test. FurMark homepage is HERE.
Settings: 1920×1080 fullscreen, no AA, no postFX, 60sec, Xtreme mode UNCHECKED.
Rule: The higher the number of points, the faster the card is.
| 8362 points (140 FPS) – EVGA GeForce GTX 580 SC, ***OCP disabled***, GPU core: 880MHz |
| 8259 points (138 FPS) – ASUS ENGTX580 ***OCP disabled***, GPU Core: 871MHz, VDDC: 1.088V |
| 7769 points (130 FPS) – EVGA GeForce GTX 580 SC, ***OCP disabled***, GPU core: 797MHz |
| 6470 points – EVGA GeForce GTX 480 |
| 6341 points (FPS: 106) – SAPPHIRE Radeon HD 6970, GPU core: 880MHz, PowerTune: +20% |
| 5841 points (97 FPS) – ASUS GeForce GTX 560 Ti DirectCU II TOP |
| 5420 points – ATI Radeon HD 5870 |
| 5383 points – ASUS Radeon HD 6950, PowerTune: +20% |
| 5161 points – MSI GeForce GTX 470 |
| 4641 points (FPS: 78) – SAPPHIRE Radeon HD 6870, GPU core: 1000MHz |
| 4583 points (FPS: 76) – SAPPHIRE Radeon HD 6870, GPU core: 980MHz |
| 4484 points (FPS: 74) – ASUS EAH6870 |
| 4310 points (FPS: 72) – SAPPHIRE Radeon HD 6870 |
| 4243 points (FPS: 71) – EVGA GeForce GTX 580 SC, OCP enabled |
| 3912 points (FPS: 65) – SAPPHIRE Radeon HD 6970, GPU core: 880MHz, PowerTune: 0 |
| 3884 points – MSI N460GTX Cyclone 768D5 OC |
| 3824 points (FPS: 64) – SAPPHIRE Radeon HD 6970, GPU core: 880MHz, PowerTune: -20% |
| 2772 points – MSI R5770 Hawk |
3.2 TessMark (OpenGL 4)
Hardware tessellation is one of the big features of Direct3D 11 and OpenGL 4 capable graphics cards. TessMark is a new benchmark focused only on the tessellation engine of DX11 class cards. It’s a pure tessellation benchmark, it does not contain complex shader or other heavy texture fetches. TessMark shows an overview of the tessellation engine raw power, that’s all. DX11 specifies that the tessellation factor can vary from 1.0 up tp 64.0. Of course, for tessellation factors like 32 or 64, most of the tessellated triangles are smaller than… a pixel. In those cases, tessellation is useless and in a real world application such as a game, high tessellation factors won’t be used. But in the case of a synthetic benchmark, it’s always instructive to see how cards can handle the whole range of tessellation level.
TessMark 0.2.2 has been used for the test.
Settings: 1920×1080 fullscreen, no AA, 60sec, map set 1.
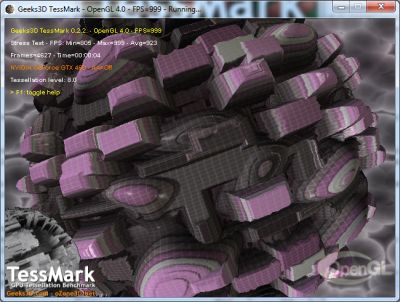
Rule: The higher the number of points, the faster the card is.
Tessellation factor 8.0: moderate
| 53151 (888FPS) – EVGA GTX 580 SC |
| 52188 (872FPS) – ASUS ENGTX580 |
| 48084 – EVGA GeForce GTX 480 |
| 39663 points (662 FPS) – ASUS GeForce GTX 560 Ti DirectCU II TOP |
| 38191 – MSI GeForce GTX 470 |
| 30512 – MSI N460GTX Cyclone 768D5 OC |
| 27718 (462FPS) – Sapphire HD 6870, GPU core: 1000MHz |
| 27469 (458FPS) – Sapphire HD 6970, GPU core: 880MHz |
| 26223 – ASUS EAH6870 |
| 25480 (425FPS) – ASUS Radeon HD 6950 |
| 24161 (403FPS) – ATI Radeon HD 5870 |
| 23131 (386FPS) – Sapphire HD 6870 |
| 20745 – MSI R5770 Hawk |
Tessellation factor 16.0: normal
| 33266 (555FPS) – EVGA GTX 580 SC |
| 32666 (545FPS) – ASUS ENGTX580 |
| 29196 – EVGA GeForce GTX 480 |
| 23594 points (393 FPS) – ASUS GeForce GTX 560 Ti DirectCU II TOP |
| 23316 – MSI GeForce GTX 470 |
| 17452 – MSI N460GTX Cyclone 768D5 OC |
| 9255 (154FPS) – Sapphire HD 6870, GPU core: 1000MHz |
| 8555 – ASUS EAH6870 |
| 8229 (137FPS) – Sapphire HD 6970, GPU core: 880MHz |
| 8177 (136FPS) – Sapphire HD 6870 |
| 8018 (134FPS) – ATI Radeon HD 5870 |
| 7669 – MSI R5770 Hawk |
| 7384 (123FPS) – ASUS HD 6950 |
Tessellation factor 32.0: extreme
| 15427 (257FPS) – EVGA GTX 580 SC |
| 15128 (252FPS) – ASUS ENGTX580 |
| 13008 – EVGA GeForce GTX 480 |
| 9997 – MSI GeForce GTX 470 |
| 9878 points (165 FPS) – ASUS GeForce GTX 560 Ti DirectCU II TOP |
| 6729 – MSI N460GTX Cyclone 768D5 OC |
| 2299 – ASUS EAH6870 |
| 2246 (38FPS) – Sapphire HD 6870 |
| 2156 (36FPS) – ATI Radeon HD 5870 |
| 2122 (35FPS) – Sapphire HD 6970, GPU core: 880MHz |
| 2159 – MSI R5770 Hawk |
| 1910 (32FPS) – ASUS HD 6950 |
Tessellation factor 64.0: insane
| 4940 (82FPS) – EVGA GTX 580 SC |
| 4840 (81FPS) – ASUS ENGTX580 |
| 3963 – EVGA GeForce GTX 480 |
| 3169 – MSI GeForce GTX 470 |
| 2895 points (48 FPS) – ASUS GeForce GTX 560 Ti DirectCU II TOP |
| 1959 – MSI N460GTX Cyclone 768D5 OC |
| 585 – ASUS EAH6870 |
| 574 (10FPS) – Sapphire HD 6870 |
| 565 – MSI R5770 Hawk |
| 550 (10FPS) – ATI Radeon HD 5870 |
| 539 (9FPS) – Sapphire HD 6970, GPU core: 880MHz |
| 485 (9FPS) – ASUS HD 6950 |
3.3 ShaderToyMark (OpenGL 2)
ShaderToyMark 0.1.0 is an OpenGL 2 benchmark, developed with GeeXLab,
and focused on pixel shaders only. The pixel shaders are heavily based on math (few texture fetches) and then ShaderToyMark can be seen as a kind of GPU computing benchmark.
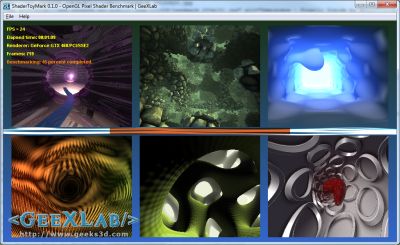
Settings: 960×540 windowed, no AA, 60sec
| 316 points (52 FPS) – EVGA GTX 580 SC |
| 306 points (51 FPS) – ASUS ENGTX580 |
| 263 points (43 FPS) – GeForce GTX 480 |
| 234 (39FPS) – Sapphire HD 6970 |
| 218 points (36 FPS) – ASUS GeForce GTX 560 Ti DirectCU II TOP |
| 208 (34FPS) – ASUS HD 6950 |
| 189 points (31 FPS) – ATI Radeon HD 5870 |
| 184 points (30 FPS) – ASUS EAH6870 |
| 179 (29FPS) – Sapphire HD 6870 |
| 156 points (26 FPS) – MSI N460GTX Cyclone |
| 104 points (17 FPS) – MSI R5770 Hawk |
| 46 points (7 FPS) – GeForce 9800 GTX |
| 36 points (6 FPS) – EVGA GTX 280 |
| 33 points (5 FPS) – GeForce GTX 260 |
3.4 OpenGL 4 Mountains demo
Mountains demo is an OpenGL 4 demo that shows hierarchical-Z map based occlusion culling in action.
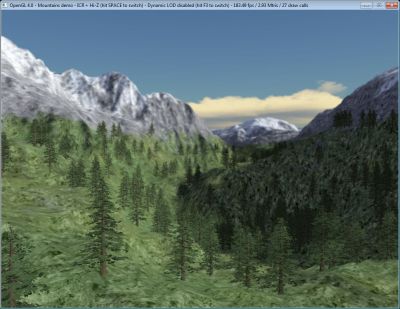
Settings: default window size: 1024×768, ICR enabled (Instance Cloud Reduction), Hi-Z enabled and dynamic LOD enabled.
| 684 FPS – EVGA GTX 580 SC |
| 674 FPS – ASUS ENGTX580 |
| 568 FPS – EVGA GTX 480 |
| 492 FPS – ASUS GeForce GTX 560 Ti DirectCU II TOP |
| 390 FPS – Sapphire Radeon HD 6970 |
| 350 FPS – MSI N460GTX Cyclone 768D5 |
| 318 FPS – ASUS Radeon HD 6950 |
| 255 FPS – ASUS EAH6870 |
| 235 FPS – Sapphire Radeon HD 6870 |
| 231 FPS – Radeon HD 5870 |
| 220 FPS – MSI R5770 Hawk |
3.5 GluxMark2 (OpenGL 2)
GluxMark2 is a purely syntethic OpenGL benchmark
and tries to measure performance from every point of view by using programmable graphics pipeline (vertex, geometry and fragment/pixel shaders).

Preset: high-end (1920×1080, MSAA: 8X)
| 11002 points (OpenCL: +4318 = 15320 points) – EVGA GTX 580 SC |
| 9216 points (OpenCL: +2776 = 11992 points) – GeForce GTX 480 |
| 8099 points – Radeon HD 5870 |
| 8026 points (OpenCL: +654 = 8680 points) – ASUS Radeon HD 6950 |
| 8010 points (OpenCL: +709 = 8719 points) – Sapphire Radeon HD 6970 |
| 7873 points (OpenCL: +4257 = 12130 points) – ASUS GeForce GTX 560 Ti DirectCU II TOP |
| 6615 points – Sapphire Radeon HD 6870 |
| 5367 points (OpenCL: +2789 = 8156 points) – MSI N460GTX Cyclone |
3.6 Unigine Heaven (OpenGL 4)
For this last OpenGL test, I used Ungine Heaven 2.1, one of the standard Direct3D / OpenGL synthetic benchmark.
Settings: 1920×1080 fullscreen, OpenGL rendering, tessellation: normal, shaders: high, AA: 4X, 16X anisotropic filtering.
| 48.6 FPS, Scores: 1224 – EVGA GTX 580 SC |
| 46.4 FPS, Scores: 1168 – ASUS ENGTX580 |
| 38.7 FPS, Scores: 974 – EVGA GeForce GTX 480 |
| 35.8 FPS, Scores: 901 – ASUS GeForce GTX 560 Ti DirectCU II TOP |
| 24.7 FPS, Scores: 622 – SAPPHIRE Radeon HD 6970 |
| 24.5 FPS, Scores: 617 – MSI N460GTX Cyclone 768D5 OC |
| 21.6 FPS, Scores: 544 – ASUS Radeon HD 6950 |
| 15.9 FPS, Scores: 400 – ATI Radeon HD 5870 |
| 13.6 FPS, Scores: 342 – ASUS EAH6870 |
| 13.5 FPS, Scores: 339 – SAPPHIRE HD6870 |
| 9 FPS, Scores: 227 – MSI R5770 Hawk |
ASUS ENGTX 560 Ti DirectCU II TOP Review Index
- 1 – ASUS GTX 560 Ti DirectCU II TOP: Presentation
- 2 – ASUS GTX 560 Ti DirectCU II TOP Features
- 3 – ASUS GTX 560 Ti DirectCU II TOP OpenGL performances
- 4 – ASUS GTX 560 Ti DirectCU II TOP Direct3D performances
- 5 – ASUS GTX 560 Ti DirectCU II TOP Gaming performances
- 6 – ASUS GTX 560 Ti DirectCU II TOP DirectCompute performances
- 7 – ASUS GTX 560 Ti DirectCU II TOP Power consumption and overclocking
- 8 – ASUS GTX 560 Ti DirectCU II TOP Conclusion
this thing is some beast..beating a GTX470 with only 8SM..they musta done some hella performance tweaks with the GF114
I think i’ll wait for a 660 then 😀
I wonder if my PSU could handle 2 of these…
At the moment it’s handling pretty well my 2 palit gtx 460 1gb which have a very similar tdp.
My PSU is a CORSAIR AX750 Gold 12cm PLUG (87+)
@Zibri: I’m sure that the AX750 can handle (without problem) two GTX 560 Ti highly stressed…
For comparison… with same settings my 2 GTX 460 score 1511 points and 60 FPS in unigine heaven.
Settings: 1920×1080 fullscreen, tessellation: normal, shaders: high, 4X MSAA, 16X anisotropic filtering.
TAKE OF THE COVER, FANS AND COOLER AND PICTURE IT PLEASE.
WANT TO SEE ITS DIFFERENCES TO REFERENCE LAYOUT.
JeGX pourquoi ne pas avoir monter les voltages ?
interdiction du fabricant , pas le temps pour peaufinner l’oc de la bête ?
dommage car la 560 ti à l’air d’etre la reine en overcloking … ou pas ?
I don’t think NVIDIA have used ‘Titatnium’ since GeForce 4?
@komar: juste pour une question de temps. Effectivement en augmentant la tension d’alim du GPU on devrait gagner quelques Hz de plus. J’essaierai de faire un test plus tard.
J’ai vu la review techpowerup de la bête ne te dérange pas .
Jetais juste curieux de savoir cb elle prenait en aircooling
Merci quand même JEGx
Greetings .
Pingback: NVIDIA R266.66 WHQL All Titanium Graphics Cards - 3D Tech News, Pixel Hacking, Data Visualization and 3D Programming - Geeks3D.com
I have to say I am quite impressed by the 560. The performance was expected, but still it’s nice to see it’s there.
noise?
@Michael: at idle, the card is extremely quiet. Under FurMark the cooler is noisy but is supportable (nothing to see with GTX 480 stock VGA cooler!). And I talk for an open case testbed…
Underwhelmed. You’ll get a 6950 for the same price using 20-30W less and has more performance. FAIL!
@DrBalthar: don’t forget the secret weapon of the GTX 560 Ti: overclocking. I will publish an article shortly 😉
Overclocking will just make it hotter and eat more power with marginal gain doubt it can cover the performance gap. Nvidia has piss poor Flop/Watt with the whole Fermi line.
Pingback: [GPU Tool] EVGA OC Scanner 1.6.0 Released - 3D Tech News, Pixel Hacking, Data Visualization and 3D Programming - Geeks3D.com
Very nice review, I was focussing my search on this reviewed card and the 6950 variant.
There are a lot of reviews of normal 560ti and 6950 based cards, but not so much of the asus direct CU versions.
I like the way you discuss things, they are righ spot on as what i was looking for.
Still not sure which card to pick, the 560Ti or the 6950 based on ASUS Direct CU II design, they are allmost the same price, but have both pros and cons.
I like playing BC2 for instance, the nvidia cards are better in this game, but what about future releases…those choices…:)
I got a 6950 hell of problems and the card was having problems with fable 3, i returned the card next day got a EVGA 560 ti next day and now is running any game over 50 fps. i will say this second ATI i buy and they all failed me.
A 6950 for the same price as a ENGTX 560 ti top CII?????? No way!!! At lease 700 bucks differance! I don’t know who ur supplier is, but no way. And I must agree with “6950 falls” ATI cards in general are very buggy and unstable, my last 3 ATI’s had constant issues, ranging from overclocking probs, to HDMI problems to even crossfire problems, ATI is just too much hassel in general. Although they are good value for money, and good performers, stick to the tried and tested man!! NVIDIA.
I just put together a nice system got it all running but the vidoe card wont display on the moniter and my motherboard has no on board video..I don’t know what I’m doing wrong.What I built was MB Asus Sabertooth X58 LGA 1366 R, PSU Antec TPQ-1200 1200W RT, CPU Intel Core 17 950 3.06G 45N R, MEM 4Gx3 KHX 1866C9D3K3 12GX R, HDD 1.5 WD WD15EARX 64M%… Any Info anyone can give would be great.