ASUS Radeon HD 6950 Review Index
- 1 – Meet with ASUS’s Radeon HD 6950
- 2 – ASUS Radeon HD 6950 Features
- 3 – ASUS Radeon HD 6950 OpenGL performances
- 4 – ASUS Radeon HD 6950 Direct3D performances
- 5 – ASUS Radeon HD 6950 Gaming performances
- 6 – ASUS Radeon HD 6950 DirectCompute performances
- 7 – ASUS Radeon HD 6950 Power consumption and overclocking
3 – ASUS Radeon HD 6950 OpenGL performances
Testbed:
– CPU: Core i7 960 @ 3.2GHz
– RAM: 4GB DDR3 Corsair Dominator
– Motherboard: GIGABYTE X58-A UD5
– Windows 7 64-bit
– Graphics drivers: Catalyst 10.12
– PSU: Corsair AX1200
3.1 FurMark (OpenGL 2)
FurMark 1.8.2 has been used for the test. FurMark homepage is HERE.
Settings: 1920×1080 fullscreen, no AA, no postFX, 60sec, Xtreme mode UNCHECKED.
Rule: The higher the number of points, the faster the card is.
| 8362 points (140 FPS) – EVGA GeForce GTX 580 SC, ***OCP disabled***, GPU core: 880MHz |
| 8259 points (138 FPS) – ASUS ENGTX580 ***OCP disabled***, GPU Core: 871MHz, VDDC: 1.088V |
| 7769 points (130 FPS) – EVGA GeForce GTX 580 SC, ***OCP disabled***, GPU core: 797MHz |
| 6470 points – EVGA GeForce GTX 480 |
| 6341 points (FPS: 106) – SAPPHIRE Radeon HD 6970, GPU core: 880MHz, PowerTune: +20% |
| 5420 points – ATI Radeon HD 5870 |
| 5383 points – ASUS Radeon HD 6950, PowerTune: +20% |
| 5161 points – MSI GeForce GTX 470 |
| 4641 points (FPS: 78) – SAPPHIRE Radeon HD 6870, GPU core: 1000MHz |
| 4583 points (FPS: 76) – SAPPHIRE Radeon HD 6870, GPU core: 980MHz |
| 4484 points (FPS: 74) – ASUS EAH6870 |
| 4310 points (FPS: 72) – SAPPHIRE Radeon HD 6870 |
| 4243 points (FPS: 71) – EVGA GeForce GTX 580 SC, OCP enabled |
| 3912 points (FPS: 65) – SAPPHIRE Radeon HD 6970, GPU core: 880MHz, PowerTune: 0 |
| 3884 points – MSI N460GTX Cyclone 768D5 OC |
| 3824 points (FPS: 64) – SAPPHIRE Radeon HD 6970, GPU core: 880MHz, PowerTune: -20% |
| 2772 points – MSI R5770 Hawk |
Remark: PowerTune has been set to +20%.
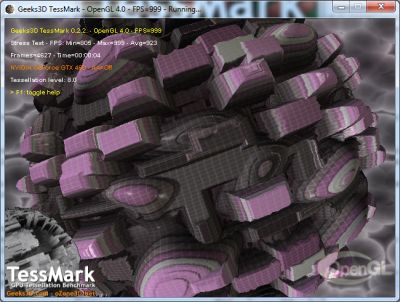
3.2 TessMark (OpenGL 4)
Hardware tessellation is one of the big features of Direct3D 11 and OpenGL 4 capable graphics cards. TessMark is a new benchmark focused only on the tessellation engine of DX11 class cards. It’s a pure tessellation benchmark, it does not contain complex shader or other heavy texture fetches. TessMark shows an overview of the tessellation engine raw power, that’s all. DX11 specifies that the tessellation factor can vary from 1.0 up tp 64.0. Of course, for tessellation factors like 32 or 64, most of the tessellated triangles are smaller than… a pixel. In those cases, tessellation is useless and in a real world application such as a game, high tessellation factors won’t be used. But in the case of a synthetic benchmark, it’s always instructive to see how cards can handle the whole range of tessellation level.
TessMark 0.2.2 has been used for the test.
Settings: 1920×1080 fullscreen, no AA, 60sec, map set 1.
Rule: The higher the number of points, the faster the card is.
Tessellation factor 8.0: moderate
| 53151 (888FPS) – EVGA GTX 580 SC |
| 52188 (872FPS) – ASUS ENGTX580 |
| 48084 – EVGA GeForce GTX 480 |
| 38191 – MSI GeForce GTX 470 |
| 30512 – MSI N460GTX Cyclone 768D5 OC |
| 27718 (462FPS) – Sapphire HD 6870, GPU core: 1000MHz |
| 27469 (458FPS) – Sapphire HD 6970, GPU core: 880MHz |
| 26223 – ASUS EAH6870 |
| 25480 (425FPS) – ASUS Radeon HD 6950 |
| 24161 (403FPS) – ATI Radeon HD 5870 |
| 23131 (386FPS) – Sapphire HD 6870 |
| 20745 – MSI R5770 Hawk |
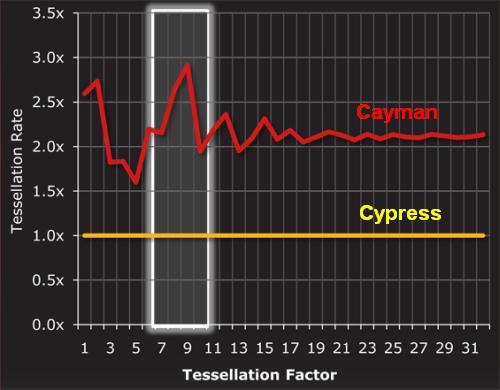
Remark: Cayman GPU implements AMD’s 8th generation tessellator (Barts is the 7th and Cypress is the 6th) and for low tessellation level, Cayman (HD 6970) should process tessellation twice faster than Cypress GPU (HD 5870). This is clearly not the case and this is certainly due to the OpenGL driver that has not been updated to reflect Cayman new architecture.
Tessellation factor 16.0: normal
| 33266 (555FPS) – EVGA GTX 580 SC |
| 32666 (545FPS) – ASUS ENGTX580 |
| 29196 – EVGA GeForce GTX 480 |
| 23316 – MSI GeForce GTX 470 |
| 17452 – MSI N460GTX Cyclone 768D5 OC |
| 9255 (154FPS) – Sapphire HD 6870, GPU core: 1000MHz |
| 8555 – ASUS EAH6870 |
| 8229 (137FPS) – Sapphire HD 6970, GPU core: 880MHz |
| 8177 (136FPS) – Sapphire HD 6870 |
| 8018 (134FPS) – ATI Radeon HD 5870 |
| 7669 – MSI R5770 Hawk |
| 7384 (123FPS) – ASUS HD 6950 |
Tessellation factor 32.0: extreme
| 15427 (257FPS) – EVGA GTX 580 SC |
| 15128 (252FPS) – ASUS ENGTX580 |
| 13008 – EVGA GeForce GTX 480 |
| 9997 – MSI GeForce GTX 470 |
| 6729 – MSI N460GTX Cyclone 768D5 OC |
| 2299 – ASUS EAH6870 |
| 2246 (38FPS) – Sapphire HD 6870 |
| 2156 (36FPS) – ATI Radeon HD 5870 |
| 2122 (35FPS) – Sapphire HD 6970, GPU core: 880MHz |
| 2159 – MSI R5770 Hawk |
| 1910 (32FPS) – ASUS HD 6950 |
Tessellation factor 64.0: insane
| 4940 (82FPS) – EVGA GTX 580 SC |
| 4840 (81FPS) – ASUS ENGTX580 |
| 3963 – EVGA GeForce GTX 480 |
| 3169 – MSI GeForce GTX 470 |
| 1959 – MSI N460GTX Cyclone 768D5 OC |
| 585 – ASUS EAH6870 |
| 574 (10FPS) – Sapphire HD 6870 |
| 565 – MSI R5770 Hawk |
| 550 (10FPS) – ATI Radeon HD 5870 |
| 539 (9FPS) – Sapphire HD 6970, GPU core: 880MHz |
| 485 (9FPS) – ASUS HD 6950 |
Remark: Cayman GPU implements AMD’s 8th generation tessellator (Barts is the 7th and Cypress is the 6th) and for low tessellation level, Cayman (HD 6970) should process tessellation twice faster than Cypress GPU (HD 5870). This is clearly not the case and this is certainly due to the OpenGL driver that has not been updated to reflect Cayman new architecture.
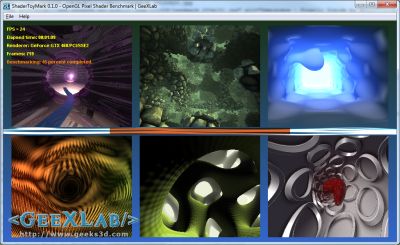
3.3 ShaderToyMark (OpenGL 2)
ShaderToyMark 0.1.0 is an OpenGL 2 benchmark, developed with GeeXLab,
and focused on pixel shaders only. The pixel shaders are heavily based on math (few texture fetches) and then ShaderToyMark can be seen as a kind of GPU computing benchmark.
Settings: 960×540 windowed, no AA, 60sec
| 316 points (52 FPS) – EVGA GTX 580 SC |
| 306 points (51 FPS) – ASUS ENGTX580 |
| 263 points (43 FPS) – GeForce GTX 480 |
| 234 (39FPS) – Sapphire HD 6970 |
| 208 (34FPS) – ASUS HD 6950 |
| 189 points (31 FPS) – ATI Radeon HD 5870 |
| 184 points (30 FPS) – ASUS EAH6870 |
| 179 (29FPS) – Sapphire HD 6870 |
| 156 points (26 FPS) – MSI N460GTX Cyclone |
| 104 points (17 FPS) – MSI R5770 Hawk |
| 46 points (7 FPS) – GeForce 9800 GTX |
| 36 points (6 FPS) – EVGA GTX 280 |
| 33 points (5 FPS) – GeForce GTX 260 |
Remark: ShaderToyMark is nice because it simply shows the raw processing power. The peak shader arithmetic (single precision FP) of the HD 6970 is 2703 GFLOPS and the one of the HD 6950 is 2253 GFLOPS.
The ratio between GLOPS is 2703 / 2253 = 1.19 while the ratio between scores is: 234 points / 208 points = 1.12.
3.4 Maxon CINEBENCH R11.5 (OpenGL 2)
CINEBENCH is an OpenGL benchmark based on Cinema4D.
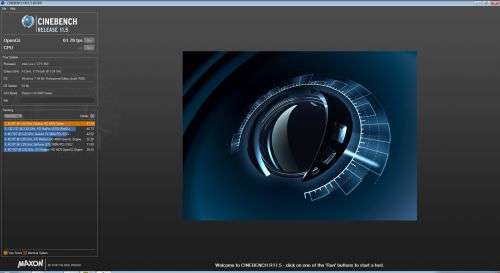
Settings: windowed mode 1920×1080.
| 61.84 FPS – ASUS Radeon HD 6950 |
| 61.79 FPS – Sapphire Radeon HD 6870 |
| 61.60 FPS – Sapphire Radeon HD 6970 |
| 61.22 FPS – Radeon HD 5870 |
| 42.84 FPS – GeForce GTX 480 |
| 42.71 FPS – EVGA GTX 580 SC |
| 42.53 FPS – MSI N460GTX Cyclone |
Remark: I don’t know why, but I feel that CINEBENCH is CPU-bound…
3.5 OpenGL 4 Mountains demo
Mountains demo is an OpenGL 4 demo that shows hierarchical-Z map based occlusion culling in action.
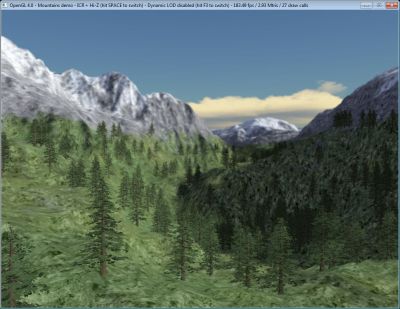
Settings: default window size: 1024×768, ICR enabled (Instance Cloud Reduction), Hi-Z enabled and dynamic LOD enabled.
| 684 FPS – EVGA GTX 580 SC |
| 674 FPS – ASUS ENGTX580 |
| 568 FPS – EVGA GTX 480 |
| 390 FPS – Sapphire Radeon HD 6970 |
| 350 FPS – MSI N460GTX Cyclone 768D5 |
| 318 FPS – ASUS Radeon HD 6950 |
| 255 FPS – ASUS EAH6870 |
| 235 FPS – Sapphire Radeon HD 6870 |
| 231 FPS – Radeon HD 5870 |
| 220 FPS – MSI R5770 Hawk |
3.6 GluxMark2 (OpenGL 2)
GluxMark2 is a purely syntethic OpenGL benchmark
and tries to measure performance from every point of view by using programmable graphics pipeline (vertex, geometry and fragment/pixel shaders).

Preset: high-end (1920×1080, MSAA: 8X)
| 11002 points (OpenCL: +4318 = 15320 points) – EVGA GTX 580 SC |
| 9216 points (OpenCL: +2776 = 11992 points) – GeForce GTX 480 |
| 8099 points – Radeon HD 5870 |
| 8026 points (OpenCL: +654 = 8680 points) – ASUS Radeon HD 6950 |
| 8010 points (OpenCL: +709 = 8719 points) – Sapphire Radeon HD 6970 |
| 6615 points – Sapphire Radeon HD 6870 |
| 5367 points (OpenCL: +2789 = 8156 points) – MSI N460GTX Cyclone |
3.7 Unigine Heaven (OpenGL 4)
For this last OpenGL test, I used Ungine Heaven 2.1, one of the standard Direct3D / OpenGL synthetic benchmark.
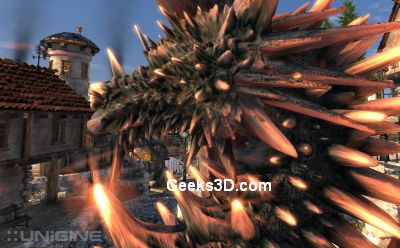
Settings: 1920×1080 fullscreen, OpenGL rendering, tessellation: normal, shaders: high, AA: 4X, 16X anisotropic filtering.
| 48.6 FPS, Scores: 1224 – EVGA GTX 580 SC |
| 46.4 FPS, Scores: 1168 – ASUS ENGTX580 |
| 38.7 FPS, Scores: 974 – EVGA GeForce GTX 480 |
| 24.7 FPS, Scores: 622 – SAPPHIRE Radeon HD 6970 |
| 24.5 FPS, Scores: 617 – MSI N460GTX Cyclone 768D5 OC |
| 21.6 FPS, Scores: 544 – ASUS Radeon HD 6950 |
| 15.9 FPS, Scores: 400 – ATI Radeon HD 5870 |
| 13.6 FPS, Scores: 342 – ASUS EAH6870 |
| 13.5 FPS, Scores: 339 – SAPPHIRE HD6870 |
| 9 FPS, Scores: 227 – MSI R5770 Hawk |
ASUS Radeon HD 6950 Review Index
- 1 – Meet with ASUS’s Radeon HD 6950
- 2 – ASUS Radeon HD 6950 Features
- 3 – ASUS Radeon HD 6950 OpenGL performances
- 4 – ASUS Radeon HD 6950 Direct3D performances
- 5 – ASUS Radeon HD 6950 Gaming performances
- 6 – ASUS Radeon HD 6950 DirectCompute performances
- 7 – ASUS Radeon HD 6950 Power consumption and overclocking
Great stuff Jego! At last some gaming benchies! 😀
Some notes:
– The links at the first page do not work. Numbers 2 through 8 point to
http://www.geeks3d.com/20110117/tested-asus-radeon-hd-6950-2gb-gddr5-review/
– Is the 6950 Crysis score correct?
Personnal notes:
– Did AMD fix Hawx 2 at last? Cool! I haven’t done any testing on my 5850s recently.
– Now that the time finally came to play Crysis as it was supposed to be played, I gotten myself two new Geforces instead of two new Radeons, lol. No regrets though. The game runs fine. It’s actually cpu limited now. 😀
Oh…and what setttings were used in Crysis?
I wonder how much of AMD GPU’s lack of performance is due to the quality of their drivers.
@Psolord: thanks for the links bug. Fixed!
And yes the HD6950 score in Crysis is correct. I will bench again HD 6970 and HD 6950 when new drivers will be available because some scores (especially in OpenGL) are not coherent. For Crysis, I used the integrated GPU benchmark with default settings (I forgot the resolution sorry).
@Ash: I think too much.
Thanks for nice sharing JeGX.
Pingback: [Test] Hybrid Systems: Radeon HD 6950 for 3D and GeForce GT 240 for OpenCL - 3D Tech News, Pixel Hacking, Data Visualization and 3D Programming - Geeks3D.com
You can get the card to run at 950 MHz. I also had difficulty with Smart Doctor. Check my review at http://www.bjorn3d.com
You can get the card to run at 970 MHz. I also had difficulty with Smart Doctor. Check my review at http://www.bjorn3d.com
i have Asus 23″ VG236HE monitor connected with hdmi 20 pin cable to asus radion hd 6970 card,
i am running windows 7/64 but i cant run 3d nvidia ?
any help ?
I just bought the ASUS EAH6950 2GB video card running on a 24inch LED monitor but i find the graphics not being sharp. The edges around the fonts are abit fuzzy and videos are not sharp as well. Anyone know why this is so?
Oh yeah, found it so annoying how i had to play around with the scaling option to get full display on my monitor!
ASUS pre-sales claims the “power-up” wattage of the P8Q67M-DO MB is 330w. This is without a proc. or RAM. Can anyone with a three digit I.Q. tell me if this sounds even remotely possible ???