
Review index:
1 – MSI N9600GT Diamond Overview and Features
2 – 3D Performance Tests (OpenGL and Direct3D)
3 – Power Consumption and Temperature
4 – GPU Computing Tests (PhysX and OpenCL)
1 – MSI N9600GT Diamond Overview and Features
Here is a quick test of MSI’s N9600GT Diamond based on NVIDIA’s GeForce 9600 GT. The GeForce 9600 GT has been released in 2008 (see here) and is still present in graphics card makers like MSI (the N9600GT Diamond was recently offered in an AfterBurner Overclocking competition and many users have this kind of card, see in Steam Hardware Survey).

The GeForce 9600 GT (based on the G94 GPU with 64 shader processors) is a half version of the GeForce 9800 (based on the G92 GPU with 128 shaders processors). In the tests below, I added the GeForce GTS 250 (based on a G92 GPU) to show the difference.
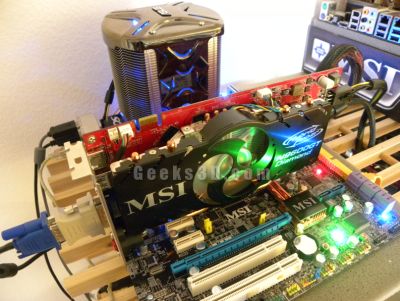
This graphics card is equipped with a custom VGA cooler, the Hybrid Frozr with four 6mm-heatpipes. This VGA cooler can work at zero noise (the fan is stopped) or with very low noise. But to take advantage of this functionality, you have to install MSI’s DualCoreCenter (in bundle with the card). This tool controls the fan speed and offers other functions such as GPU monitoring (clocks, temperatures…).

Without DualCoreCenter, the fan is rather noisy. But when DualCoreCenter is running, the noise produced by the fan is very acceptable and you can work / play near the card without problem.
On another interesting feature is the OC button (the big red button):

This OC button allows to overclock the card on the fly making the core clock jumping from 650MHz to 710MHz and memory clock from 850MHz to 900MHz. From the marketing docs, you can do it directly but from my tests, you have to install the DualCoreCenter to enjoy the OC button.
MSI N9600GT main features:
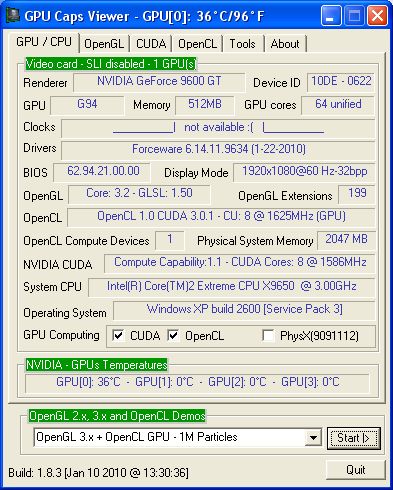
- GPU: G94 @ 650MHz / 65nm
- Shaders processors: 64 @ 1625MHz
- Memory: 512MB GDDR3 @ 850MHz / 256-bit
- 3D APIs: OpenGL 3.2, Direct3D 10
- GPU Computing: OpenCL 1.0, CUDA 3.0, PhysX
- CUDA Compute Capability: 1.1
- CUDA streaming multiprocessors: 8 @ 1625MHz
- TDP: 52 Watts
- Price: around $100US

2 – 3D Performance Tests (OpenGL and Direct3D)

Testbed configuration:
– CPU: Intel Core 2 Extreme X9650 @ 3GHz (default clocks)
– RAM: Corsair 2x1GB DDR3 1333MHz C9 (default clocks)
– Motherboard: MSI P45D3 Platinium
– PSU: Antec TRUEPOWER Quattro 850W
– Windows XP SP3 32-bit
– ForceWare 196.34.
Unigine Heaven
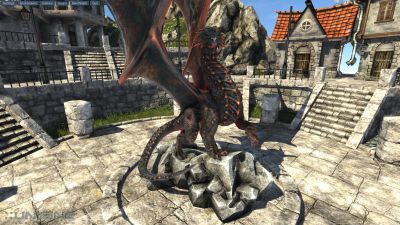
Unigine Heaven is a demo / benchmark based on the Unigine engine. The benchmark exposes several rendering paths: OpenGL 2, Direct3D 9, Direct3D 10 and Direct3D 11. In this test, I use OpenGL 2 and Direct3D 9 paths.
Unigine Heaven settings:
– shaders: high
– textures: high
– filtering: trilinear, anisotropy: 4X
– MSAA: 0X
– Occlusion, refraction and volumetric: enabled
Direct3D 9 scores
| Video card | 1920×1080 |
| MSI N9600GT | 476 (18.9FPS) |
| GeForce GTS 250 | 735 (29.2FPS) |
| MSI R4850 | 694 (27.6FPS) |
OpenGL 2 scores
| Video card | 1920×1080 |
| MSI N9600GT | 441 (17.5FPS) |
| GeForce GTS 250 | 684 (27.1FPS) |
| MSI R4850 | 497 (19.7FPS) |
FurMark 1.8.0

FurMark is Geeks3D’s stress test and OpenGL benchmark. The version 1.8.0 has an increased graphics workload so the scores you get with this version will be lower than the ones with FurMark 1.7.0.
FurMark 1.8.0 settings:
– fullscreen
– 60 seconds
Scores (no effect + MSAA 0X)
| Video card | 1280×1024 | 1920×1080 |
| MSI N9600GT | 1194 | 1079 |
| GeForce GTS 250 | 2469 | 2256 |
| MSI R4850 | 1454 | 1321 |
Scores (displacement mapping + MSAA 0X)
| Video card | 1280×1024 | 1920×1080 |
| MSI N9600GT | 872 | 798 |
| GeForce GTS 250 | 1769 | 1625 |
| MSI R4850 | 1109 | 1015 |
Impact of MSAA on MSI N9600GT
| MSAA | 1280×1024 | 1920×1080 |
| 0X | 1194 | 1079 |
| 4X | 1155 | 1040 |
| 8X | 881 | 790 |
| 16X | 313 | 275 |
3 – Power consumption and Temperature
Idle power consumption of the testbed with MSI N9600GT: 105W.
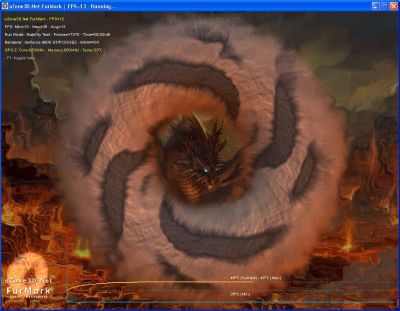
I used the latest version of FurMark with all effects: Xtreme burning mode, postFX and displacement mapping. With these settings, the GPU temperature reached 46°C (very nice temperature) and the total power consumption of the testbed was 164 Watts.
MSI N9600GT power draw: (164-105) * 0.8 = 47.2 Watts.
The official TDP is 52W then with default clocks the N9600GT does not reach its limits under heavy load.

Overclocking: OC Button
This N9600GT is ready for simple overclocking thanks to the OC button. Okay let’s see the impact of this button with FurMark.
– total system power consumption: 172 Watts
– MSI N9600GT power draw: (172-105) * 0.8 = 53.6 Watts.
Now with 53W, we are above the TDP of 52W. That could damage the graphics card if the card has to support this graphics load during a long time. But keep in mind that FurMark produces a very high power draw which is not the case of most 3D applications like video games.
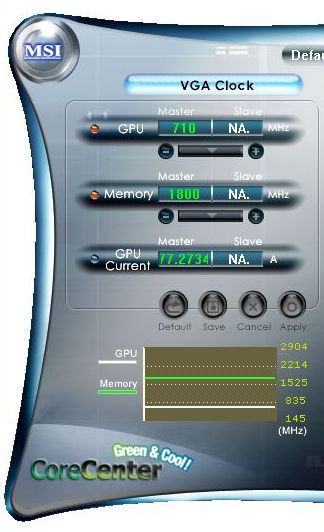
Notice the current required by the GPU: 77 A.
And what about FurMark scores with this built-in overclocking?
– 1280×1024: 1326 points – compared to the non-overclocked score (1194), the gain is around 11%.
– 1920×1080: 1199 points – compared to the non-overclocked score (1074), the gain is around 11%.
4 – GPU Computing Tests (PhysX and OpenCL)
PhysX FluidMark 1.1.1

FluidMark is Geeks3D’s PhysX-based benchmark.
FluidMark settings:
– fullscreen
– 60 seconds
– 1920×1080
– MSAA: 0X
| Video card | 1920×1080 |
| PhysX CPU | 1212 |
| PhysX GPU – MSI N9600GT | 5470 |
| PhysX GPU – GeForce GTS 250 | 9234 |
OpenCL Tests
I launched two OpenCL tests included in GPU Caps Viewer 1.8.x.
1 – PostFX (600×600)
- global memory: 14 FPS
- local memory: 29 FPS
2 – PostFX (1280×1024)
- global memory: 4 FPS
- local memory: 8 FPS
3 – 1M Particles (600×600)
- GL interop: 130 FPS
- No GL interop: 70 FPS
More information about these OpenCL tests can be found in this article: GPU Computing – GeForce and Radeon OpenCL Test.
Pingback: Cooler Master Lab Test Bench | JeGX's Infamous Lab