
Article index
- 1 – Overview
- 2 – Gallery
- 3 – GPU information
- 4 – Benchmarks
- 4.1 – 3DMark FireStrike (1920×1080)
- 4.2 – 3DMark FireStrike Ultra (4K / 3840×2160)
- 4.3 – 3DMark TimeSpy (Direct3D 12)
- 4.4 – 3DMark Port Royal (Direct3D 12 Raytracing)
- 4.5 – Unigine Superposition – 1080p Medium – Direct3D
- 4.6 – Unigine Superposition – 4K Optimized – Direct3D
- 4.7 – FurMark
- 4.8 – Rhodium LC
- 4.9 – MSI Kombustor 4 – TessMark X32 OpenGL
- 4.10 – BasemarkGPU – Vulkan
- 5 – Burn-in Test
- 6 – Conclusion
1 – Overview
Today, the last day of 2020, I’m going to review the ASUS TUF GAMING Radeon RX 6800 XT OC 16G. Yeah! My first Big Navi GPU! This graphics card is based on the Navi 21 GPU built on AMD’s RDNA2 architecture (26.8 billion transistors, 7nm process). This RX 6800 XT has 72 compute units (4608 shader cores), 288 textures units, 64 ROPs and 72 ray accelerators units (for ray tracing!) for a total power consumption of 300W.
2 – Gallery
The industrial look of this TUF Radeon RX 6800 XT comes from its full aluminum shroud (2.9-slot design). Three 10cm fans (the rotation of the center fan is reversed) cool the whole card in a semi-passive mode: under 55°C, the fans are stopped (full passive mode, 0dB) and above 60°C, the fans start spinning (active mode).


This RX 6800 XT has a dual BIOS mode: a switch allows to select the P mode (Performance mode, default) or the Q mode (Quiet mode).

An aluminum backplate covers the full underside of the card:

Two 8-pin power connectors (150W per connector) provide the power required by this beast during heavy graphics works:

The card has one HDMI 2.1 and three DisplayPort 1.4a ports:

The size:

The TUF RX 6800 XT versus ASUS Strix RX 5700:

3 – GPU Information
The usual GPU Caps Viewer and GPU-Z screenshots.


In the marketing specs, we can read:
– OC mode : up to 2340 MHz (Boost Clock)/ 2090 MHz (Game Clock)
– Gaming mode : up to 2310 MHz (Boost Clock)/ 2065 MHz (Game Clock)
I did a quick test to check the max GPU clock speed. I started one of my GPU tools (TessMark) and displayed the GPU clock speed with GPU-Z:

This RX 6800 XT sample can jump to 2490 MHz. Nice!
4 – GPU Benchmarks
| Test System | |
|---|---|
| CPU | Intel Core i7-8700K @ 3.7GHz |
| Motherboard | GIGABYTE Z390 Gaming X |
| Memory | 16GB DDR4 Corsair Vengeance LED @ 3000MHz |
| PSU | Corsair AX860i |
| Storage | Samsung 840 Pro 256GB SSD |
| OS | Windows 10 v2009 64-bit |
4.1 – 3DMark FireStrike (1920×1080)
| 28965 (graphics:48432, physics:17880, combined:9416) ASUS TUF Radeon RX 6800 XT OC 16GB – Adrenalin 20.12.2 |
| 22185 (graphics:29130, physics:17988, combined:9100) GIGABYTE GeForce RTX 3060 Ti Gaming OC 8G – GeForce 460.79 |
| 22166 (graphics:28314, physics:18072, combined:9686) ASUS ROG Strix GeForce RTX 2080 OC 8GB – GeForce 460.89 |
| 19511 (graphics:23584, physics:17962, combined:9010) ASUS Strix Radeon RX 5700 – Adrenalin 20.12.2 |
| 19146 (graphics:22604, physics:18585, combined:9109) ASUS ROG Strix GeForce GTX 1080 OC 8GB – GeForce 416.94 |
| 19118 (graphics:22150, physics:18587, combined:9639) MSI GeForce RTX 2070 Ventus 8GB – GeForce 417.01 |
| 16504 (graphics:19574, physics:18586, combined:29143) MSI Radeon RX Vega 56 AIR BOOST – Adrenalin 18.11.1 |
| 16414 (graphics:18561, physics:18629, combined:8025) EVGA GeForce GTX 1070 FTW – GeForce 416.94 |
| 12248 (graphics:14084, physics:18494, combined:4931) SAPPHIRE Radeon RX 5500 XT Pulse – Adrenalin 20.01.3 |
| 11708 (graphics:13426, physics:18640, combined:4651) MSI Radeon R9 290X – Adrenalin 18.11.1 |
| 11538 (graphics:13079, physics:18534, combined:4711) EVGA GeForce GTX 1060 SC 6GB – GeForce 416.94 |
| 11075 (graphics:12839, physics:18597, combined:4201) MSI Radeon RX 470 8GB – Adrenalin 18.11.1 |
| 10292 (graphics:11368, physics:18595, combined:4325) MSI GeForce GTX 970 – GeForce 416.94 |
| 7899 (graphics:8616, physics:18629, combined:3175) MSI Radeon HD 7970 – Adrenalin 18.11.1 |
4.2 – 3DMark FireStrike Ultra (4K / 3840×2160)
| 11992 (graphics:12703, physics:17901, combined:6265) ASUS TUF Radeon RX 6800 XT OC 16GB – Adrenalin 20.12.2 |
| 7314 (graphics:7292, physics:18008, combined:3917) GIGABYTE GeForce RTX 3060 Ti Gaming OC 8G – GeForce 460.79 |
| 6805 (graphics:6713, physics:18125, combined:3711) ASUS ROG Strix GeForce RTX 2080 OC 8GB – GeForce 460.89 |
| 5813 (graphics:5913, physics:17914, combined:2718) ASUS Strix Radeon RX 5700 – Adrenalin 20.12.2 |
| 5517 (graphics:5446, physics:18595, combined:2819) ASUS ROG Strix GeForce GTX 1080 OC 8GB – GeForce 416.94 |
| 5242 (graphics:5113, physics:18601, combined:2777) MSI GeForce RTX 2070 Ventus 8GB – GeForce 417.01 |
| 4634 (graphics:4654, physics:18592, combined:2148) MSI Radeon RX Vega 56 AIR BOOST – Adrenalin 18.11.1 |
| 4593 (graphics:4512, physics:18631, combined:2304) EVGA GeForce GTX 1070 FTW – GeForce 416.94 |
| 3497 (graphics:3491, physics:18493, combined:1589) SAPPHIRE Radeon RX 5500 XT Pulse – Adrenalin 20.01.3 |
| 3117 (graphics:3013, physics:18669, combined:4711) EVGA GeForce GTX 1060 SC 6GB – GeForce 416.94 |
| 2869 (graphics:2830, physics:18652, combined:1325) MSI Radeon RX 470 8GB – Adrenalin 18.11.1 |
| 2681 (graphics:2594, physics:18622, combined:1321) MSI GeForce GTX 970 – GeForce 416.94 |
4.3 – 3DMark TimeSpy (Direct3D 12, 2560×1440)
| 13617 (graphics:16294, cpu:7952) ASUS TUF Radeon RX 6800 XT OC 16GB – Adrenalin 20.12.2 |
| 10077 (graphics:10837, CPU:7213) GIGABYTE GeForce RTX 3060 Ti Gaming OC 8G – GeForce 460.79 |
| 9714 (graphics:10415, cpu:7248) ASUS ROG Strix GeForce RTX 2080 OC 8GB – GeForce 460.89 |
| 8252 (graphics:8461, cpu:7239) MSI GeForce RTX 2070 Ventus 8GB – GeForce 417.01 |
| 7925 (graphics:8063, cpu:7227) ASUS Strix Radeon RX 5700 – Adrenalin 20.12.2 |
| 7524 (graphics:7562, cpu:7316) ASUS ROG Strix GeForce GTX 1080 OC 8GB – GeForce 416.94 |
| 6284 (graphics:6144, cpu:7218) MSI Radeon RX Vega 56 AIR BOOST – Adrenalin 18.11.1 |
| 6284 (graphics:6131, cpu:7324) EVGA GeForce GTX 1070 FTW – GeForce 416.94 |
| 5033 (graphics:4776, cpu:7242) SAPPHIRE Radeon RX 5500 XT Pulse – Adrenalin 20.01.3 |
| 4524 (graphics:4244, cpu:7239) EVGA GeForce GTX 1060 SC 6GB – GeForce 416.94 |
| 4259 (graphics:3966, cpu:7338) MSI Radeon R9 290X – Adrenalin 18.11.1 |
| 3957 (graphics:3660, cpu:7330) MSI Radeon RX 470 8GB – Adrenalin 18.11.1 |
| 3814 (graphics:3515, cpu:7368) MSI GeForce GTX 970 – GeForce 416.94 |
4.4 – 3DMark Port Royal (Direct3D 12 + Raytracing)
| 9149 (165+ FPS) ASUS TUF Radeon RX 6800 XT OC 16GB – Adrenalin 20.12.2 |
| 6916 GIGABYTE GeForce RTX 3060 Ti Gaming OC 8G – GeForce 460.79 |
| 6863 ASUS ROG Strix GeForce RTX 2080 OC 8GB – GeForce 460.89 |
4.5 – Unigine Superposition – 1080p Medium – Direct3D
| 21154 (avg FPS: 175) GIGABYTE GeForce RTX 3060 Ti Gaming OC 8G – GeForce 460.79 |
| 20985 (avg FPS: 157) ASUS TUF Radeon RX 6800 XT OC 16GB – Adrenalin 20.12.2 |
| 20903 (avg FPS: 156) ASUS ROG Strix GeForce RTX 2080 OC 8GB – GeForce 460.89 |
| 16419 (avg FPS: 122.8) ASUS ROG Strix GeForce GTX 1080 OC 8GB – GeForce 416.94 |
| 16001 (avg FPS: 119.7) MSI GeForce RTX 2070 Ventus 8GB – GeForce 417.01 |
| 14390 (avg FPS: 107) ASUS Strix Radeon RX 5700 – Adrenalin 20.12.2 |
| 13039 (avg FPS: 97.5) EVGA GeForce GTX 1070 FTW – GeForce 416.94 |
| 12078 (avg FPS: 90.3) MSI Radeon RX Vega 56 AIR BOOST – Adrenalin 18.11.1 |
| 9266 (avg FPS: 69) SAPPHIRE Radeon RX 5500 XT Pulse – Adrenalin 20.01.3 |
| 9082 (avg FPS: 67.9) EVGA GeForce GTX 1060 SC 6GB – GeForce 416.94 |
| 8290 (avg FPS: 62) MSI Radeon R9 290X – Adrenalin 18.11.1 |
| 7469 (avg FPS: 55.9) MSI GeForce GTX 970 – GeForce 416.94 |
| 7127 (avg FPS: 53.3) MSI Radeon RX 470 8GB – Adrenalin 18.11.1 |
| 5332 (avg FPS: 39.9) MSI Radeon HD 7970 – Adrenalin 18.11.1 |
4.6 – Unigine Superposition – 4K Optimized – Direct3D
| 13469 (avg FPS: 100) ASUS TUF Radeon RX 6800 XT OC 16GB – Adrenalin 20.12.2 |
| 9495 (avg FPS: 71) GIGABYTE GeForce RTX 3060 Ti Gaming OC 8G – GeForce 460.79 |
| 9241 (avg FPS: 69) ASUS ROG Strix GeForce RTX 2080 OC 8GB – GeForce 460.89 |
| 7014 (avg FPS: 52.5) ASUS ROG Strix GeForce GTX 1080 OC 8GB – GeForce 416.94 |
| 6936 (avg FPS: 51.9) MSI GeForce RTX 2070 Ventus 8GB – GeForce 417.01 |
| 6299 (avg FPS: 47) ASUS Strix Radeon RX 5700 – Adrenalin 20.12.2 |
| 5639 (avg FPS: 42.2) EVGA GeForce GTX 1070 FTW – GeForce 416.94 |
| 5060 (avg FPS: 37.8) MSI Radeon RX Vega 56 AIR BOOST – Adrenalin 18.11.1 |
| 3886 (avg FPS: 29.1) EVGA GeForce GTX 1060 SC 6GB – GeForce 416.94 |
| 3863 (avg FPS: 29) SAPPHIRE Radeon RX 5500 XT Pulse – Adrenalin 20.01.3 |
| 3026 (avg FPS: 22.6) MSI Radeon RX 470 8GB – Adrenalin 18.11.1 |
4.7 – FurMark 1.24
P1080 (1920×1080)
| 17507 (avg FPS: 292) ASUS TUF Radeon RX 6800 XT OC 16GB – Adrenalin 20.12.2 |
| 10530 (avg FPS: 175) GIGABYTE GeForce RTX 3060 Ti Gaming OC 8G – GeForce 460.79 |
| 10320 (avg FPS: 172) ASUS ROG Strix GeForce RTX 2080 OC 8GB – GeForce 460.89 |
| 9270 (avg FPS: 154) MSI GeForce RTX 2070 Ventus 8GB – GeForce 417.01 |
| 7810 (avg FPS: 130) ASUS Strix Radeon RX 5700 – Adrenalin 20.12.2 |
| 7322 (avg FPS: 122) ASUS ROG Strix GeForce GTX 1080 OC 8GB – GeForce 416.94 |
| 6691 (avg FPS: 112) MSI Radeon RX Vega 56 AIR BOOST – Adrenalin 18.11.1 |
| 6201 (avg FPS: 103) EVGA GeForce GTX 1070 FTW – GeForce 416.94 |
| 4946 (avg FPS: 83) MSI Radeon R9 290X – Adrenalin 18.11.1 |
| 4556 (avg FPS: 76) EVGA GeForce GTX 1060 SC 6GB – GeForce 416.94 |
| 4475 (avg FPS: 75) SAPPHIRE Radeon RX 5500 XT Pulse – Adrenalin 20.01.3 |
| 3845 (avg FPS: 64) MSI GeForce GTX 970 – GeForce 416.94 |
| 3367 (avg FPS: 56) MSI Radeon RX 470 8GB – Adrenalin 18.11.1 |
| 3246 (avg FPS: 54) MSI Radeon HD 7970 – Adrenalin 18.11.1 |
P2160 (3840×2160)
| 6001 (avg FPS: 100) ASUS TUF Radeon RX 6800 XT OC 16GB – Adrenalin 20.12.2 |
| 4018 (avg FPS: 67) GIGABYTE GeForce RTX 3060 Ti Gaming OC 8G – GeForce 460.79 |
| 3819 (avg FPS: 64) ASUS ROG Strix GeForce RTX 2080 OC 8GB – GeForce 460.89 |
| 3165 (avg FPS: 52) MSI GeForce RTX 2070 Ventus 8GB – GeForce 417.01 |
| 2734 (avg FPS: 46) ASUS ROG Strix GeForce GTX 1080 OC 8GB – GeForce 416.94 |
| 2658 (avg FPS: 45) ASUS Strix Radeon RX 5700 – Adrenalin 20.12.2 |
| 2261 (avg FPS: 38) MSI Radeon RX Vega 56 AIR BOOST – Adrenalin 18.11.1 |
| 2217 (avg FPS: 37) EVGA GeForce GTX 1070 FTW – GeForce 416.94 |
| 1718 (avg FPS: 29) SAPPHIRE Radeon RX 5500 XT Pulse – Adrenalin 20.01.3 |
| 1600 (avg FPS: 27) MSI Radeon R9 290X – Adrenalin 18.11.1 |
| 1556 (avg FPS: 26) EVGA GeForce GTX 1060 SC 6GB – GeForce 416.94 |
| 1330 (avg FPS: 22) MSI GeForce GTX 970 – GeForce 416.94 |
| 1071 (avg FPS: 18) MSI Radeon HD 7970 – Adrenalin 18.11.1 |
| 1030 (avg FPS: 17) MSI Radeon RX 470 8GB – Adrenalin 18.11.1 |
4.8 – Rhodium LC
Rhodium LC (LC for Liquid Carbon!) is a new GPU pixel shader benchmark made with GeeXLab and based on this shadertoy demo. You can download RhodiumLC from THIS PAGE.

P1080 (1920×1080)
| 5740 (avg FPS: 95) ASUS TUF Radeon RX 6800 XT OC 16GB – Adrenalin 20.12.2 |
| 4853 (avg FPS: 80) ASUS ROG Strix GeForce RTX 2080 OC 8GB – GeForce 416.94 |
| 3905 (avg FPS: 65) GIGABYTE GeForce RTX 3060 Ti Gaming OC 8G – GeForce 460.79 |
| 3650 (avg FPS: 60) ASUS ROG Strix GeForce GTX 1080 OC 8GB – GeForce 416.94 |
| 3461 (avg FPS: 57) MSI GeForce RTX 2070 Ventus 8GB – GeForce 417.01 |
| 2835 (avg FPS: 47) EVGA GeForce GTX 1070 FTW – GeForce 416.94 |
| 2773 (avg FPS: 46) ASUS Strix Radeon RX 5700 – Adrenalin 20.12.2 |
| 2640 (avg FPS: 43) MSI Radeon RX Vega 56 AIR BOOST – Adrenalin 18.11.1 |
| 1923 (avg FPS: 32) EVGA GeForce GTX 1060 SC 6GB – GeForce 416.94 |
| 1755 (avg FPS: 29) SAPPHIRE Radeon RX 5500 XT Pulse – Adrenalin 20.01.3 |
| 1484 (avg FPS: 24) MSI GeForce GTX 970 – GeForce 416.94 |
| 1418 (avg FPS: 23) MSI Radeon R9 290X – Adrenalin 18.11.1 |
| 1192 (avg FPS: 19) MSI Radeon RX 470 8GB – Adrenalin 18.11.1 |
| 937 (avg FPS: 15) MSI Radeon HD 7970 – Adrenalin 18.11.1 |
P2160 (3840×2160)
| 1854 (avg FPS: 30) ASUS TUF Radeon RX 6800 XT OC 16GB – Adrenalin 20.12.2 |
| 1269 (avg FPS: 21) ASUS ROG Strix GeForce RTX 2080 OC 8GB – GeForce 416.94 |
| 995 (avg FPS: 16) GIGABYTE GeForce RTX 3060 Ti Gaming OC 8G – GeForce 460.79 |
| 930 (avg FPS: 15) ASUS ROG Strix GeForce GTX 1080 OC 8GB – GeForce 416.94 |
| 892 (avg FPS: 14) MSI GeForce RTX 2070 Ventus 8GB – GeForce 417.01 |
| 735 (avg FPS: 12) EVGA GeForce GTX 1070 FTW – GeForce 416.94 |
| 698 (avg FPS: 11) ASUS Strix Radeon RX 5700 – Adrenalin 20.12.2 |
| 669 (avg FPS: 11) MSI Radeon RX Vega 56 AIR BOOST – Adrenalin 18.11.1 |
| 497 (avg FPS: 8) EVGA GeForce GTX 1060 SC 6GB – GeForce 416.94 |
| 450 (avg FPS: 7) SAPPHIRE Radeon RX 5500 XT Pulse – Adrenalin 20.01.3 |
| 378 (avg FPS: 6) MSI GeForce GTX 970 – GeForce 416.94 |
| 305 (avg FPS: 5) MSI Radeon RX 470 8GB – Adrenalin 18.11.1 |
| 302 (avg FPS: 5) MSI Radeon R9 290X – Adrenalin 18.11.1 |
| 231 (avg FPS: 3) MSI Radeon HD 7970 – Adrenalin 18.11.1 |
4.9 – MSI Kombustor 2019 – TessMark X32 OpenGL

P1080 (1920×1080)
| 19985 (avg FPS: 333) ASUS ROG Strix GeForce RTX 2080 OC 8GB – GeForce 460.89 |
| 18406 (avg FPS: 306) GIGABYTE GeForce RTX 3060 Ti Gaming OC 8G – GeForce 460.79 |
| 17054 (avg FPS: 284) ASUS TUF Radeon RX 6800 XT OC 16GB – Adrenalin 20.12.2 |
| 8815 (avg FPS: 146) ASUS Strix Radeon RX 5700 – Adrenalin 20.12.2 |
4.10 – Basemark GPU (Vulkan)
Basemark GPU is a professional benchmark to evaluate and compare graphics performance across mobile and desktop platforms and supports all major graphics APIs and operating systems.

Version: Basemark GPU 1.2.3
Settings: official test, Vulkan, 3840×2160, bc7
| 15968 (avg FPS: 160) ASUS TUF GAMING RX 6800 XT – Adrenalin 20.12.2 |
| 11860 (avg FPS: 119) GIGABYTE GeForce RTX 3060 Ti Gaming OC 8G – GeForce 460.79 |
| 11389 (avg FPS: 114) ASUS ROG Strix GeForce RTX 2080 OC 8G – GeForce 460.79 |
| 7502 (avg FPS: 75) ASUS Strix Radeon RX 5700 8G – Adrenalin 20.12.2 |
5 – Burn-in Test
This burn-in test has been done with FurMark 1.24.1 (1920×1080 in wiindowed mode on a 4K monitor).
As usual, the first thing to do before running a stress test is to set to the max the power target limit otherwise the driver will downclock the GPU. I used AMD Radeon Adrenalin control panel: in manual mode, you can increase the power limit by 15%:

Idle state
– total power consumption: 38W
– GPU temperature: 34°C
– GPU chip power draw: 7W
Load state – +15% power limit
– total power consumption: 449W
– GPU temperature: 73°C
– Chip power draw: 312W @ 2160MHz
I stressed the RX 6800 XT during 20 minutes at a 1920×1080 resolution. During the stress test, the framerate was constant at around 323 FPS and fans were spinning. I tested quieter GPU cooler… but don’t panic, the noise is acceptable.
Thermal Imaging
– idle state:
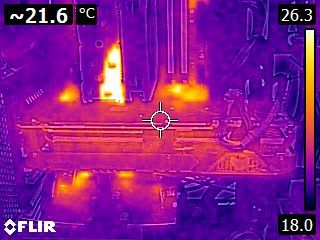
– during stress test:

6 – Conclusion
This card is the fastest graphics card I tested. It ranks the top place in most of the tests. But things can change with the GeForce RTX 3080, I hope to test it in the upcoming weeks…
The TUF RX 6800 XT is absolutely silent in idle and in lightweight graphics workloads (GPU temperature less than 55°C). Under important graphics workloads, the GPU cooler produces a moderate noise.
The industrial design of the graphics card shroud is cool, I like it.
The 16GB of GDDR6 graphics memory are also appreciable even they were not fully utilized in this review. But for 4K gaming or VR, 16GB can be advantageous.
One of the interesting things with the new RDNA2 architecture, is the support of hardware accelerated ray tracing. I’m currently working on ray tracing in Vulkan (TUF work!!!) and first ray traced demos begin to work in GeeXLab. These demos work fine on a GeForce RTX 20/30. On the RX 6800 XT, they work too, but with some strange limitations or crashes. Probably my Vulkan code or/and AMD graphics drivers. More on ray tracing very soon, in 2021!
I forgot, but this card has an illuminated logo:
