EVGA GeForce GTX 580 SC Review Index
- 1 – Meet with EVGA’s GeForce GTX 580 SC
- 2 – EVGA GeForce GTX 580 SC Features
- 3 – EVGA GeForce GTX 580 SC OpenGL performances
- 4 – EVGA GeForce GTX 580 SC Direct3D performances
- 5 – EVGA GeForce GTX 580 SC Gaming performances
- 6 – EVGA GeForce GTX 580 SC DirectCompute performances
- 7 – EVGA GeForce GTX 580 SC Power consumption and overclocking
- 8 – EVGA GeForce GTX 580 SC: Misc Links and Reviews
3 – EVGA GeForce GTX 580 SC OpenGL performances
Testbed:
– CPU: Core i7 960 @ 3.2GHz
– RAM: 4GB DDR3 Corsair Dominator
– Motherboard: GIGABYTE X58-A UD5
– Windows 7 64-bit
– Graphics drivers: R263.09
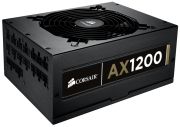
– PSU: Corsair AX1200
3.1 FurMark (OpenGL 2)
FurMark 1.8.2 has been used for the test. FurMark homepage is HERE.
Settings: 1920×1080 fullscreen, no AA, no postFX, 60sec, Xtreme mode UNCHECKED.
Rule: The higher the number of points, the faster the card is.
| 8362 points (140 FPS) – EVGA GeForce GTX 580 SC, ***OCP disabled***, GPU core: 880MHz |
| 8259 points (138 FPS) – ASUS ENGTX580 ***OCP disabled***, GPU Core: 871MHz, VDDC: 1.088V |
| 7769 points (130 FPS) – EVGA GeForce GTX 580 SC, ***OCP disabled***, GPU core: 797MHz |
| 6470 points – EVGA GeForce GTX 480 |
| 5420 points – ATI Radeon HD 5870 |
| 5161 points – MSI GeForce GTX 470 |
| 4641 points (FPS: 78) – SAPPHIRE Radeon HD 6870, GPU core: 1000MHz |
| 4583 points (FPS: 76) – SAPPHIRE Radeon HD 6870, GPU core: 980MHz |
| 4484 points (FPS: 74) – ASUS EAH6870 |
| 4310 points (FPS: 72) – SAPPHIRE Radeon HD 6870 |
| 4243 points (FPS: 71) – EVGA GeForce GTX 580 SC, OCP enabled |
| 3884 points – MSI N460GTX Cyclone 768D5 OC |
| 2772 points – MSI R5770 Hawk |
3.2 TessMark (OpenGL 4)
Hardware tessellation is one of the big features of Direct3D 11 and OpenGL 4 capable graphics cards. TessMark is a new benchmark focused only on the tessellation engine of DX11 class cards. It’s a pure tessellation benchmark, it does not contain complex shader or other heavy texture fetches. TessMark shows an overview of the tessellation engine raw power, that’s all. DX11 specifies that the tessellation factor can vary from 1.0 up tp 64.0. Of course, for tessellation factors like 32 or 64, most of the tessellated triangles are smaller than… a pixel. In those cases, tessellation is useless and in a real world application such as a game, high tessellation factors won’t be used. But in the case of a synthetic benchmark, it’s always instructive to see how cards can handle the whole range of tessellation level.
TessMark 0.2.2 has been used for the test.
Settings: 1920×1080 fullscreen, no AA, 60sec, map set 1.
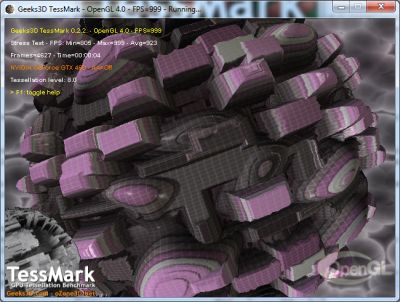
Rule: The higher the number of points, the faster the card is.
Tessellation factor 8.0: moderate
| 53151 (888FPS) – EVGA GTX 580 SC |
| 52188 (872FPS) – ASUS ENGTX580 |
| 48084 – EVGA GeForce GTX 480 |
| 38191 – MSI GeForce GTX 470 |
| 30512 – MSI N460GTX Cyclone 768D5 OC |
| 27718 (462FPS) – Sapphire HD 6870, GPU core: 1000MHz |
| 26223 – ASUS EAH6870 |
| 24161 (403FPS) – ATI Radeon HD 5870 |
| 23131 (386FPS) – Sapphire HD 6870 |
| 20745 – MSI R5770 Hawk |
Tessellation factor 16.0: normal
| 33266 (555FPS) – EVGA GTX 580 SC |
| 32666 (545FPS) – ASUS ENGTX580 |
| 29196 – EVGA GeForce GTX 480 |
| 23316 – MSI GeForce GTX 470 |
| 17452 – MSI N460GTX Cyclone 768D5 OC |
| 9255 (154FPS) – Sapphire HD 6870, GPU core: 1000MHz |
| 8555 – ASUS EAH6870 |
| 8177 (136FPS) – Sapphire HD 6870 |
| 8018 (134FPS) – ATI Radeon HD 5870 |
| 7669 – MSI R5770 Hawk |
Tessellation factor 32.0: extreme
| 15427 (257FPS) – EVGA GTX 580 SC |
| 15128 (252FPS) – ASUS ENGTX580 |
| 13008 – EVGA GeForce GTX 480 |
| 9997 – MSI GeForce GTX 470 |
| 6729 – MSI N460GTX Cyclone 768D5 OC |
| 2299 – ASUS EAH6870 |
| 2246 (38FPS) – Sapphire HD 6870 |
| 2156 (36FPS) – ATI Radeon HD 5870 |
| 2159 – MSI R5770 Hawk |
Tessellation factor 64.0: insane
| 4940 (82FPS) – EVGA GTX 580 SC |
| 4840 (81FPS) – ASUS ENGTX580 |
| 3963 – EVGA GeForce GTX 480 |
| 3169 – MSI GeForce GTX 470 |
| 1959 – MSI N460GTX Cyclone 768D5 OC |
| 585 – ASUS EAH6870 |
| 574 (10FPS) – Sapphire HD 6870 |
| 565 – MSI R5770 Hawk |
| 550 (10FPS) – ATI Radeon HD 5870 |
3.3 ShaderToyMark (OpenGL 2)
ShaderToyMark 0.1.0 is an OpenGL 2 benchmark, developed with GeeXLab,
and focused on pixel shaders only. The pixel shaders are heavily based on math (few texture fetches) and then ShaderToyMark can be seen as a kind of GPU computing benchmark.
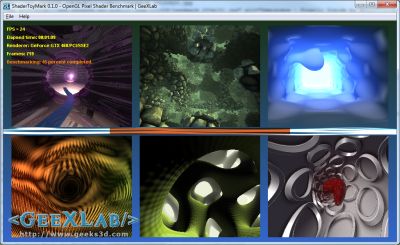
Settings: 960×540 windowed, no AA, 60sec
| 316 points (52 FPS) – EVGA GTX 580 SC |
| 306 points (51 FPS) – ASUS ENGTX580 |
| 263 points (43 FPS) – GeForce GTX 480 |
| 189 points (31 FPS) – ATI Radeon HD 5870 |
| 184 points (30 FPS) – ASUS EAH6870 |
| 179 (29FPS) – Sapphire HD 6870 |
| 156 points (26 FPS) – MSI N460GTX Cyclone |
| 104 points (17 FPS) – MSI R5770 Hawk |
| 46 points (7 FPS) – GeForce 9800 GTX |
| 36 points (6 FPS) – EVGA GTX 280 |
| 33 points (5 FPS) – GeForce GTX 260 |
3.4 Maxon CINEBENCH R11.5 (OpenGL 2)
CINEBENCH is an OpenGL benchmark based on Cinema4D.
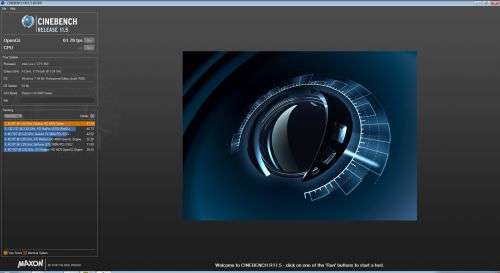
Settings: windowed mode 1920×1080.
| 61.79 FPS – Sapphire Radeon HD 6870 |
| 61.22 FPS – Radeon HD 5870 |
| 42.84 FPS – GeForce GTX 480 |
| 42.71 FPS – EVGA GTX 580 SC |
| 42.53 FPS – MSI N460GTX Cyclone |
3.5 OpenGL 4 Mountains demo
Mountains demo is an OpenGL 4 demo that shows hierarchical-Z map based occlusion culling in action.
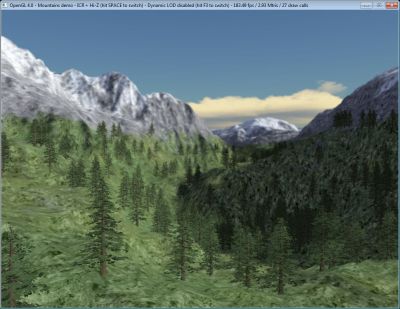
Settings: default window size: 1024×768, ICR enabled (Instance Cloud Reduction), Hi-Z enabled and dynamic LOD enabled.
| 684 FPS – EVGA GTX 580 SC |
| 674 FPS – ASUS ENGTX580 |
| 568 FPS – EVGA GTX 480 |
| 350 FPS – MSI N460GTX Cyclone 768D5 |
| 255 FPS – ASUS EAH6870 |
| 235 FPS – Sapphire Radeon HD 6870 |
| 231 FPS – Radeon HD 5870 |
| 220 FPS – MSI R5770 Hawk |
3.6 GluxMark2 (OpenGL 2)
GluxMark2 is a purely syntethic OpenGL benchmark
and tries to measure performance from every point of view by using programmable graphics pipeline (vertex, geometry and fragment/pixel shaders).

Preset: high-end (1920×1080, MSAA: 8X)
| 11002 points (OpenCL: +4318 = 15320 points) – EVGA GTX 580 SC |
| 9216 points (OpenCL: +2776 = 11992 points) – GeForce GTX 480 |
| 8099 points – Radeon HD 5870 |
| 6615 points – Sapphire Radeon HD 6870 |
| 5367 points (OpenCL: +2789 = 8156 points) – MSI N460GTX Cyclone |
3.7 Unigine Heaven (OpenGL 4)
For this last OpenGL test, I used Ungine Heaven 2.1, one of the standard Direct3D / OpenGL synthetic benchmark.
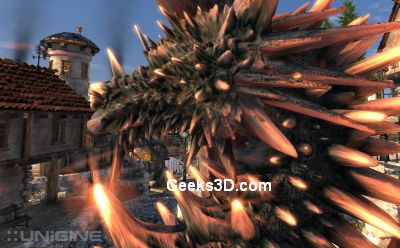
Settings: 1920×1080 fullscreen, OpenGL rendering, tessellation: normal, shaders: high, AA: 4X, 16X anisotropic filtering.
| 48.6 FPS, Scores: 1224 – EVGA GTX 580 SC |
| 46.4 FPS, Scores: 1168 – ASUS ENGTX580 |
| 38.7 FPS, Scores: 974 – EVGA GeForce GTX 480 |
| 24.5 FPS, Scores: 617 – MSI N460GTX Cyclone 768D5 OC |
| 15.9 FPS, Scores: 400 – ATI Radeon HD 5870 |
| 13.6 FPS, Scores: 342 – ASUS EAH6870 |
| 13.5 FPS, Scores: 339 – SAPPHIRE HD6870 |
| 9 FPS, Scores: 227 – MSI R5770 Hawk |
Pingback: 3DMARK11: New Gamer’s Benchmark for DirectX 11 is There (+ Big Pictures) - 3D Tech News, Pixel Hacking, Data Visualization and 3D Programming - Geeks3D.com
Pingback: [Tested] 3DMARK11 DX11 Battle: GTX 580 vs GTX 480 vs HD 6870 vs HD 5870 vs GTX 460 vs HD 5770 - 3D Tech News, Pixel Hacking, Data Visualization and 3D Programming - Geeks3D.com
Pingback: [Tested and Burned] SAPPHIRE Radeon HD 6970 2048MB Review - 3D Tech News, Pixel Hacking, Data Visualization and 3D Programming - Geeks3D.com
Pingback: NVIDIA R266.35 Drivers Available for All GeForce Graphics Cards - 3D Tech News, Pixel Hacking, Data Visualization and 3D Programming - Geeks3D.com
Pingback: [Tested] ASUS Radeon HD 6950 2GB GDDR5 Review - 3D Tech News, Pixel Hacking, Data Visualization and 3D Programming - Geeks3D.com
Pingback: [Tested and Burned] ASUS GeForce GTX 560 Ti DirectCU II TOP Review - 3D Tech News, Pixel Hacking, Data Visualization and 3D Programming - Geeks3D.com