SAPPHIRE Radeon HD 6870 Review Index
- 1 – Meet with SAPPHIRE’s Radeon HD 6870
- 2 – SAPPHIRE Radeon HD 6870 Features
- 3 – SAPPHIRE Radeon HD 6870 OpenGL performances
- 4 – SAPPHIRE Radeon HD 6870 Direct3D performances
- 5 – SAPPHIRE Radeon HD 6870 Gaming performances
- 6 – SAPPHIRE Radeon HD 6870 DirectCompute performances
- 7 – SAPPHIRE Radeon HD 6870 Power consumption and overclocking
- 8 – SAPPHIRE Radeon HD 6870: Misc Links and Reviews
5 – SAPPHIRE Radeon HD 6870 Game Performances
This review adds a new part: gaming performance. Synthetic benchmark are cool (from a developer point of view) but many readers are not developers and then wish to see benchmarks based on real video games. I mainly used benchmarks included in game demos and then, dear readers, if you know other game demos that include a benchmark, just let me know.
5.1 Crysis (DirectX 10)
I used the integrated GPU benchmark (64-bit) option provided with Crysis demo.
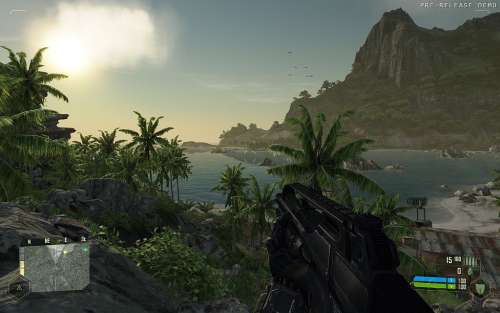
Settings: default.
Results: Average FPS for the TimeDemo Run 0.
| 73.60 FPS – Sapphire HD 6870 |
| 73.55 FPS – Radeon HD 5870 |
| 69.34 FPS – GeForce GTX 480 |
| 65.20 FPS – MSI N460GTX Cyclone |
5.2 DiRT 2 (DirectX 11)
I used the benchmarking option provided with DiRT2 demo.
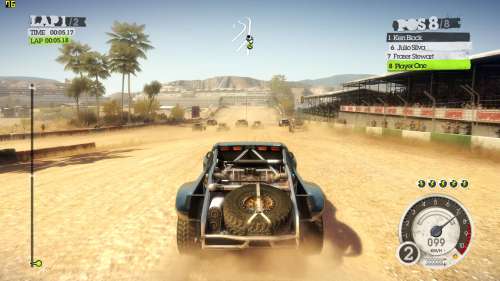
Settings: 1920×1080, 4X MSAA.
| 121.6 FPS – GeForce GTX 480 |
| 88.74 FPS – MSI N460GTX Cyclone |
| 88.14 FPS – Radeon HD 5870 |
| 85.54 FPS – Sapphire HD 6870 |
5.3 Resident Evil 5 (DirectX 10)
I used the benchmarking option (DX10 version) provided with Resident Evil 5 demo.

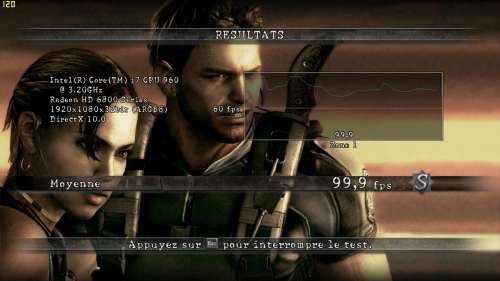
Settings: 1920×1080. 4XMSAA
| 116.6 FPS – GeForce GTX 480 |
| 104.5 FPS – Radeon HD 5870 |
| 99.9 FPS – Sapphire HD 6870 |
| 86.4 FPS – MSI N460GTX Cyclone |
5.4 Aliens vs Predator (AvP) Benchmark (DirectX 11)
Aliens vs Predator or AvP is a Direct3D 11 benchmark with a touch of tessellation. See here for more details:
AvP DX11 Tessellation Battle: GTX 480 vs GTX 470 vs HD 5870 vs HD 5770.

Settings: Resolution: 1920 x 1080, Texture Quality: 2, Shadow Quality: 3, Anisotropic Filtering: 16, SSAO: ON, Vertical Sync: OFF
DX11 Tessellation: ON, DX11 Advanced Shadows: ON, DX11 MSAA Samples: 1.
| 58.3 FPS – GeForce GTX 480 |
| 58.2 FPS – Radeon HD 5870 |
| 47.4 FPS – Sapphire HD 6870 |
| 37 FPS – MSI N460GTX Cyclone |
5.5 Lost Planet 2 (DirectX 11)
Lost Planet 2 has been used for the test.

Settings: 1920×1080 fullscreen, test A.
| 79.9 FPS – ASUS ENGTX580 |
| 60.2 FPS – EVGA GeForce GTX 480 |
| 48.8 FPS – MSI GeForce GTX 470 |
| 42.3 FPS – Sapphire Radeon HD 6870 |
| 39 FPS – ASUS EAH6870 |
| 38 FPS – MSI N460GTX Cyclone 768D5 OC |
| 37.3 FPS – ATI Radeon HD 5870 |
| 23 FPS – MSI R5770 Hawk |
5.6 Tom Clancy’s H.A.W.X. 2 (DirectX 11)
HAWX2 is a Direct3D 11 benchmark, promoted by NVIDIA, with tessellation.

Settings: 1920×1080, tessellation ON, AA: 4X
| Avg FPS: 185 – ASUS ENGTX580 |
| Avg FPS: 181 – EVGA GTX 480 |
| Avg FPS: 137 – ASUS EAH6870 |
| Avg FPS: 132 – Sapphire Radeon HD 6870 |
| Avg FPS: 136 – ATI Radeon HD 5870 |
| Avg FPS: 108 – MSI N460GTX Cyclone 768D5 OC |
| Avg FPS: 98 – MSI R5770 Hawk |
SAPPHIRE Radeon HD 6870 Review Index
- 1 – Meet with SAPPHIRE’s Radeon HD 6870
- 2 – SAPPHIRE Radeon HD 6870 Features
- 3 – SAPPHIRE Radeon HD 6870 OpenGL performances
- 4 – SAPPHIRE Radeon HD 6870 Direct3D performances
- 5 – SAPPHIRE Radeon HD 6870 Gaming performances
- 6 – SAPPHIRE Radeon HD 6870 DirectCompute performances
- 7 – SAPPHIRE Radeon HD 6870 Power consumption and overclocking
- 8 – SAPPHIRE Radeon HD 6870: Misc Links and Reviews
GTX 580 for Crysis, where is it?
GTX 580 Crysis score is for the next review. I’m testing a GTX 580 from EVGA…
guys seriously consider putting the index on the bottom of the site too.. using home key is a bit annoying and unfamiliar
@Lokadivu: done!
OK, will you then compare 6870 vs 580 ?
Radeons are fast enough in games, artificial bench demos it’s about the same as Sunspider bench who cares about that.
@iPristy: sure, all previous scores (HD 5870, HD 6870, GTX 4xx) will be in EVGA GTX 580 review.
Pingback: [Tested and Burned] EVGA GeForce GTX 580 SC Review - 3D Tech News, Pixel Hacking, Data Visualization and 3D Programming - Geeks3D.com
Pingback: [GPU Tool] ShaderToyMark 0.2.0 Demomakers’ Benchmark Available with Better SLI and CrossFire Support - 3D Tech News, Pixel Hacking, Data Visualization and 3D Programming - Geeks3D.com
Pingback: AMD Catalyst 10.12 WHQL (OpenGL 4.1, OpenCL 1.1) - 3D Tech News, Pixel Hacking, Data Visualization and 3D Programming - Geeks3D.com
Pingback: [Tested and Burned] SAPPHIRE Radeon HD 6970 2048MB Review - 3D Tech News, Pixel Hacking, Data Visualization and 3D Programming - Geeks3D.com
Pingback: [Tested] ASUS Radeon HD 6950 2GB GDDR5 Review - 3D Tech News, Pixel Hacking, Data Visualization and 3D Programming - Geeks3D.com
Pingback: [Tested and Burned] ASUS GeForce GTX 560 Ti DirectCU II TOP Review - 3D Tech News, Pixel Hacking, Data Visualization and 3D Programming - Geeks3D.com
these opengl tests do not at all reflect the performance of real opengl applications.
when using the latest fermi architecutre in opengl heavy 3d apps like blender, maya and so on the true weakness of these cards emerge.
it would be really great if you could add a test done in blender to the ones yu already did to see how the “real” opengl performance is.